The $50 Billion Problem: Why Remote Asset Monitoring is Critical for You in 2026

.avif)
Imagine a 2 a.m. alarm jolting a plant manager awake: the main production line has ground to a halt, costing $250,000 per hour in lost output, rush parts, and furious customer calls. This isn't fiction—it's the daily reality for too many industrial OEMs and enterprises, feeding into a global $50 billion annual tab for unplanned downtime.
Why Asset Performance Visibility Can’t Be Ignored
1. The Staggering Invisibility Cost: Remember the midnight failure? That traces back to a bearing that overheated unnoticed in weeks, one of countless “invisible” assets bleeding money across industries. Unplanning downtime alone drains around $50 billion yearly from manufacturers, with remote asset markets surging toward $86 billion by 2030 at 22.9% CAGR as companies fighting back. 82% of companies report such outages averaging $2 million each, plus hidden hits like $400 million in annual construction theft and 30% wasted tool buys from misplacement.
2. The Drained Revenue: Picture an automotive plant: one hour down equals millions vanished, while oil & gas sites lose $149 million yearly per facility from unchecked failures. Manufacturing faces around $500,000 hourly hits, with Asia Pacific leading remote monitoring adoption in 2025 due to these pressures. These aren't spreadsheets—they're missed shipments, layoffs, and eroded market share when visibility fails.
3. Why Traditional Maintenance Approaches Are Failing: Reactive fixes chase breakdowns at peak cost; scheduled checks miss 82% of random failures because calendars ignore real wear. The visibility gap means operators manage shadows, not assets—until a silent failure strikes.
The Challenges Faced by Industrial OEMs and Enterprises
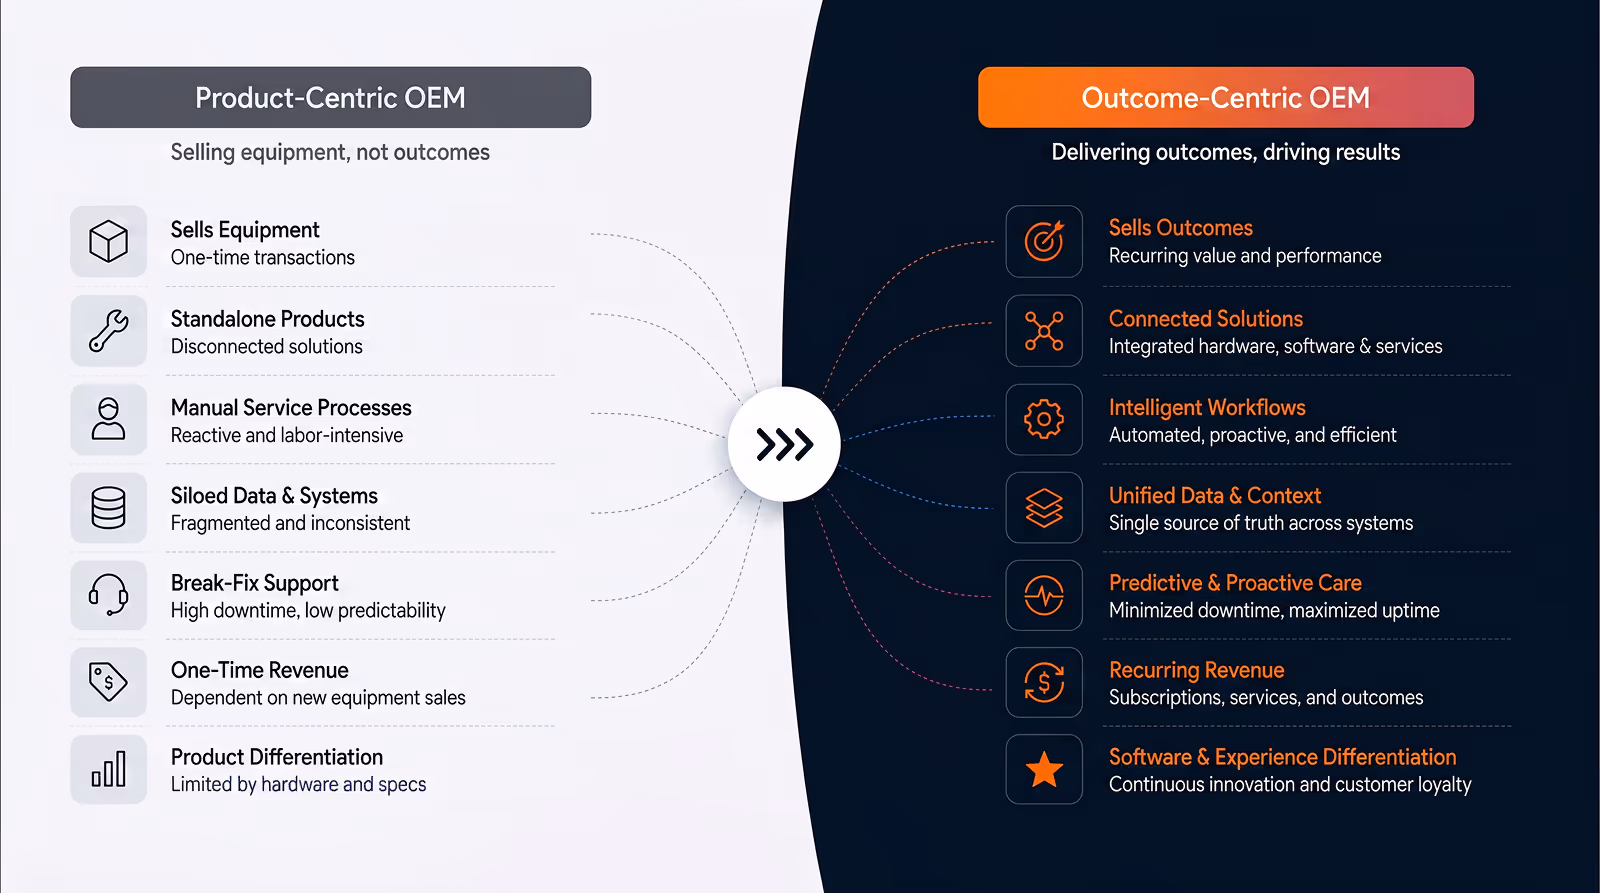
1. The Disconnect Between OEMs and Deployed Assets: OEMs ship assets worldwide, then go blind: the assets scatter across sites with no live performance view, sparking customer rage over surprise breakdowns and ballooning warranties from avoidable issues.
2. The Missing Aftermarket Opportunity: One-time sales starve service revenue, but "equipment-as-a-service" flips that—predictive contracts premium-price uptime, boosting lifetime value as connected assets become revenue engines.
3. Competitive Pressure: The "Smart Equipment" Mandate: Buyers demand proactive support; "invisibility of assets” makes them lose bids to data-smart rivals offering real-time insights and differentiation through Industrial IoT services.
What is Remote Monitoring
Every OEM and enterprise needs to run more efficiently, whether to fix the cost of doing business, identify and measure potential equipment failures before the chances of occurrence, or buffer against the shortage of talent. This is where remote monitoring can help. With remote monitoring, you can have eyes on your assets and know the exact condition (whether they are used at their full capacity, where are they located, etc).
Every enterprise needs to run more efficiently, whether to combat the cost of doing business, identify and prevent potential equipment failures before they happen, or buffer against a talent shortage. Industrial remote monitoring can help. With remote monitoring, your industrial operation can have eyes and ears at the most remote locations, without having to send personnel to those sites for every issue, large or small.
At its heart, remote monitoring fuses IoT sensors capturing raw machine signals with edge devices for initial processing, linked via protocols like MQTT, OPC-UA, or HTTP/HTTPS to cloud platforms and data lakes. AI/ML engines then distil this into visualization dashboards and instant alerts, creating a seamless bridge from hardware to human decisions. Systems harvest operational metrics like temperature, vibration, pressure, and current draw alongside performance indicators such as efficiency and throughput, plus location tracking, geofencing, usage patterns, duty cycles, and environmental exposures. This rich dataset reveals not just "what's happening" but "why" assets degrade over time. Raw feeds evolve through real-time monitoring into AI-driven predictions hitting 90% failure accuracy while trimming costs 12%, with digital twins simulating scenarios and IDC forecasting 50% edge-processed enterprise data by 2025. This layer turns noise into foresight, spotting issues weeks ahead.
How Remote Monitoring Works
.avif)
1. Edge Layer: Collecting data at the source: Smart sensors detect issues instantly while edge computing enables local decisions, with robust connectivity ensuring reliability across wired, wireless, or cellular networks in harsh conditions.
2. Platform Layer: Data Integration and Processing: At this layer, multi-source data aggregates for real-time and batch handling, undergoes cleansing and validation, then integrates seamlessly with ERP, CRM, MES, and PLM for enterprise-wide flow.
3. Analytics Layer: Intelligence and Predictions: Machine learning trains on historical patterns for anomaly detection, predictive failure modelling, and root-cause analysis, delivering proactive alerts that prevent disruptions.
4. Application Layer: Business Solutions and Actions: User-friendly dashboards visualize trends, alerts escalate priorities, work orders auto-generate, and customer portals share insights—turning data into daily actions.
Remote Monitoring Use-cases
a. For OEMs: Gaining Revenue from Products: For OEMs, remote asset monitoring is the bridge from selling equipment once to building a recurring, data-driven service business. Instead of losing sight of equipment the moment it leaves the factory, industrial OEMs and Enterprises stay connected to every critical asset in the field and see how it lives, works, and fails over time.
- Remote diagnostics and troubleshooting: When a customer call with “It’s making a weird noise,” service teams no longer rely on guesswork or site visits. They pull up live vibration, temperature, and usage data from that specific machine, compare it to its own historical baseline, and pinpoint likely root causes in minutes. This reduces first-time fix failures, cuts truck rolls, and turns support from reactive hotline to proactive partner.
- Predictive maintenance services: Instead of time-based service contracts (“we’ll come every six months”), OEMs can offer condition-based agreements that trigger maintenance only when the asset’s health indicators say it’s needed. That means fewer unnecessary visits, less disruption for the customer, and less risk of surprise breakdowns in between.
- Usage-based and performance-based pricing: With granular usage data, OEMs can move from selling equipment as a capital purchase to models like “pay per hour of operation,” “pay per part produced,” or “pay per ton moved.” This aligns cost with value delivered, lowers barriers to adoption for customers, and creates long-term, predictable revenue for the OEM.
- Customer success monitoring: Monitoring fleets across customers lets organizations see who underutilizing assets is, who is consistently running outside recommended ranges, and who is at risk of recurring failures. That insight enables targeted training, configuration tweaks, and upsells (for example, better cooling, filtration, or control software) that genuinely improve outcomes.
- Product performance analytics for research and development: Engineering teams finally get real-world data instead of lab assumptions. They can see which designs hold up, which components have early failures, how different environments affect performance, and which software updates improve reliability. This shortens design cycles, de-risks innovation, and ensures the next product generation is grounded in reality, not theory.
Look at this case study: https://www.iot83.com/case-studies/enabling-digital-transformation-for-a-leading-oem-in-refrigeration
b. For Industrial Enterprises: Manufacturing plants live and die by uptime, throughput, and quality. Remote asset monitoring turns lines from a collection of isolated machines into a coordinated, observable system.
- Production line optimization: By monitoring key metrics—cycle time, speed, temperature, vibration, pressure—across the entire line, manufacturers can see how subtle changes at one station ripple downstream. Bottlenecks become visible: maybe a filler is always slowing after a certain temperature, or a conveyor motor trips under specific loads. Over time, this enables data-backed decisions on where to invest in upgrades, buffers, or redesigns.
- Quality control and defect detection: Defects rarely appear out of nowhere; they are often preceded by small drifts in process conditions. Correlating quality outcomes with sensor data (for example, temperature during curing, torque during fastening, or vibration during cutting) reveals early warning signatures. The system can then flag “at-risk” batches or even stop production before a full run of scrap is produced.
- Energy management and sustainability: High-resolution monitoring of motors, compressors, HVAC, and process equipment exposes where energy is wasted—idling machines left powered, compressors with leaks, or suboptimal load sharing. Plants can then adjust operating schedules, right-size equipment, and reduce peak demand charges, all while strengthening ESG and sustainability metrics.
- Supply chain visibility and buffering: Condition and throughput data from critical equipment feeds into supply planning. If a line is trending towards reduced capacity due to a planned intervention, procurement, and logistics can adjust orders, safety stocks, or outsourcing plans earlier, avoiding last-minute chaos.
- Regulatory compliance and audit readiness: Continuous data capture with time-stamped logs makes it much easier to prove compliance with safety, environmental, or quality standards. Instead of manually compiling evidence, plants can pull reports showing that equipment was operated within specified ranges, maintenance was performed when required, and alarms were handled appropriately.
Look at this case study: https://www.iot83.com/case-studies/flex-powered-high-precision-flow-metering-solution-for-americas-mission-critical-equipment-manufacturer
c. For Energy and Utilities: Energy and utility infrastructure is capital-intensive, safety-critical, and often geographically dispersed. Downtime is not just expensive—it can be politically and socially visible.
- Power generation asset monitoring: Turbines, boilers, generators, and associated balance-of-plant equipment generate vast amounts of data. Remote monitoring consolidates this into clear health scores, anomaly alerts, and performance benchmarks, enabling operators to detect issues like vibration anomalies, thermal stress, or combustion inefficiencies well before they threaten availability.
- Renewable energy optimization: Solar and wind assets are often remote and variable. Monitoring systems track performance at the panel, string, inverter, or turbine level, highlighting underperforming units caused by soiling, shading, component wear, or control issues. This allows technicians to focus on high-impact interventions and maximize yield.
- Grid stability and flexibility: With real-time data from distributed energy resources (DERs) such as rooftop solar, batteries, and microgrids, utilities can better balance supply and demand. Remote monitoring ensures that assets respond correctly to dispatch signals and that ancillary services (like frequency regulation) are delivered as promised.
- Environmental and regulatory compliance: Emissions, effluents, and other environmental parameters can be monitored continuously and reported automatically. This reduces the risk of non-compliance fines and helps utilities demonstrate progress against climate and ESG targets with hard data.
d. For Transportation and Logistics: For fleet-heavy businesses—trucking, shipping, rail, last-mile delivery—remote monitoring is the nervous system that links vehicle health, driver behaviour, cargo integrity, and customer service into one view.
- Vehicle health and uptime management: Sensors on engines, brakes, tires, and critical systems detect early deviations such as abnormal temperatures, pressures, or vibrations. Fleet managers can schedule maintenance before roadside breakdowns occur, preventing service disruptions and costly recovery operations.
- Route optimization and dynamic planning: When vehicle condition and performance data is combined with traffic, weather, and load constraints, routing decisions can account for both efficiency and risk. For example, a truck with a marginally overheating component can be directed to a nearby depot instead of sent on a long cross-country run.
- Cargo condition tracking: For temperature-sensitive or high-value goods, monitoring load temperature, humidity, shock, and door open events keeps cargo within specification from warehouse to customer. Alerts notify operators when conditions drift outside thresholds, enabling corrective action before spoilage or damage occurs.
- Driver safety and performance: Telematics data reveals patterns such as harsh braking, speeding, long driving hours without rest, and fuel-wasting habits. Enterprises can use this to provide coaching, improve safety outcomes, and reward efficient driving behaviors, reducing accidents and insurance costs.
- Maintenance cost reduction and lifecycle optimization: Over time, the data tells a story about each vehicle: how it’s driven, how it ages, and when it should be retired or repurposed. This supports smarter capital planning, more accurate TCO models, and better choices about when to refurbish versus replace.
IMPLEMENTATION ROADMAP - From Pilot to Enterprise Scale
Phase 1: Assessment and Planning (Weeks 1-4): Identify high-impact assets, set KPIs, select tech stacks, allocate budgets, and align stakeholders for a focused launch.
Phase 2: Pilot Deployment (Months 2-4): Start with small numbers of assets: install sensors, validate data, train models, and showcase quick ROI to build momentum.
Phase 3: Scale and Integration (Months 5-12): Expand coverage, integrate with core systems, refine AI, train teams, and optimize processes enterprise-wide.
Phase 4: Optimization and Innovation (Year 1+): Pursue continuous tweaks, new use cases, customer services, digital twins, and AR for business model reinvention.
Choosing the Right Solution
Building the right remote asset monitoring solution isn't about picking the shiniest platform—it's about matching capabilities to your specific assets, operations, and business goals while avoiding vendor lock-in and hidden costs. Below, we break down the key criteria across platform features, vendor strengths, and strategic sourcing decisions, with practical questions to guide your due diligence.
1. Platform Capabilities to Evaluate: The platform is the brain of your remote monitoring system, so prioritize features that handle your current needs and scale with future ambitions. Start by mapping your assets (legacy vs. modern, fixed vs. mobile) and data volumes, then test these core capabilities hands-on during demos or proofs-of-concept.
- IoT Device Connectivity and Management: Does the platform support your hardware ecosystem? Look for broad protocol compatibility (MQTT, OPC-UA, Modbus, CoAP) and gateways that bridge legacy equipment without full rip-and-replace. Key checks: remote device provisioning, over-the-air (OTA) updates, and fleet management for thousands of sensors across sites. Poor connectivity means data gaps; robust options ensure 99.9% uptime even in remote or harsh environments.
- Data Handling and Analytics Capabilities: Beyond storage, evaluate ingestion rates for high-frequency data (e.g., 1-second vibration samples), real-time streaming vs. batch processing, and built-in cleansing tools to filter noise. Strong platforms offer time-series databases, data lakes, and basic analytics like thresholding or aggregation—essential for spotting trends across fleets without custom coding.
- AI/ML Intelligence Features: Seek on prior anomaly detection, predictive modelling (e.g., remaining useful life estimates), and auto-baselining for each asset type. Advanced ones include digital twin integration and explainable AI, so you understand why a failure is predicted (e.g., "vibration pattern matches 85% of past bearing failures"). Test accuracy on your data—aim for 85-90% precision to justify the investment.
- API Integration Ecosystem: Open APIs are non-negotiable for tying into ERP (SAP, Oracle), CMMS (Maximo, UpKeep), MES, or CRM systems. Check RESTful APIs, webhooks for alerts, and SDKs for custom extensions. A rich partner ecosystem (e.g., pre-built connectors for Siemens or Rockwell) speeds deployment and future-proofs against silos.
- Visualization and Reporting Tools: Dashboards should be intuitive with role-based views (operator vs. executive), mobile apps, and customizable widgets (heatmaps, health scores, trend charts). Exportable reports and scheduled alerts ensure compliance and stakeholder updates, turning data into decisions without IT bottlenecks.
2. Vendor Assessment Criteria: Vendors range from nimble startups to industrial giants—assess them holistically to avoid shiny demos that crumble at scale. Use RFPs with weighted scoring and reference calls with similar customers.
3. Build vs. Buy vs. Partner Decisions: No one-size-fits-all—your choice depends on internal IT/OT maturity, time-to-value, and strategic data ownership. Most succeed with hybrids, blending control and speed.
- Build In-House
Build-in-house approach is only ideal if you have strong dev teams, unique domain needs, and long-term data monetization plans.
Pros: total customization, IP ownership.
Cons: 12-24 months to MVP, $1M+ dev costs, ongoing maintenance burden. Best for large OEMs with software divisions (e.g., GE Digital-style).
- Buy Off-the-Shelf Platform
Buying off-the-shelf platforms is the fastest path.
Pros: proven scalability, rapid deployment (weeks), continuous updates.
Cons: less customization, potential vendor dependency. Suited for enterprises prioritizing ROI over uniqueness—95% of adopters go this route for quick wins.
- Partner with System Integrators
Engage with firms for custom setups on commercial platforms.
Pros: leverages your domain knowledge with their integration expertise, handles change management.
Cons: higher upfront fees. Great for complex brownfield sites or multi-vendor fleets.
Why Flex83 is the Right Platform for Your Remote Asset Monitoring Solution
When it’s about selecting a platform, Flex83 stands out as the proven choice for OEMs and industrial enterprises ready to tackle the $50 billion downtime crisis head-on. Flex83 combines enterprise-grade scalability with intuitive tools that deliver rapid value without the complexity of custom builds or the limitations of generic solutions.
Key Flex83 Capabilities That Drive Results
- Seamless Industrial IoT Connectivity Across Your Fleet: Flex83- the AIoT platform supports every major industrial protocol out of the box-- MQTT, OPC-UA, Modbus, CoAP, and more—plus gateways that connect legacy equipment without rewiring. It can manage thousands of sensors and devices from a single pane, with OTA updates, remote provisioning, and 99.9% uptime even in remote oilfields or harsh manufacturing floors.
- Powerful Built-In Analytics and AI: Flex83's pre-trained ML models deliver anomaly detection, predictive failure forecasting (85-90% accuracy on common assets), and remaining useful life estimates tuned for industrial equipment.
- Frictionless Enterprise Integration: RESTful APIs, webhooks, and 50+ pre-built connectors plug straight into SAP, ERP, CMMS, MES systems, and even CRM platforms. You can export asset health scores to work orders automatically, feed performance data into production planning, and share customer portals for transparency—all without custom code.
- Intuitive Visualization for Every Role: Role-based dashboards put operators on mobile alerts, maintenance on prioritized worklists, and executives on fleet-wide risk heatmaps. Custom widgets, scheduled reports, and exportable compliance logs turn raw data into daily decisions, without extending your current digital solutions team.
- Security and Global Scale: Zero-trust architecture, end-to-end encryption, SOC 2/ISO 27001 compliance, and IoT-specific features like firmware signing protect against rising cyber threats. Geo-redundant cloud/hybrid deployment scales effortlessly from pilot to 100,000+ assets across continents.
Conclusion: Act Now—Visibility is Your Competitive Edge
The $50 billion downtime problem isn't going away; it's accelerating as competition intensifies, customer expectations rise, and smart competitors connect every asset. Inaction means bleeding profits through invisible failures, missed service revenue, and eroding market position—while early adopters like those on Flex83 lock in double-digit savings, new business models, and resilient operations.
Remote asset monitoring isn't a "nice-to-have" technology in 2026; it's the foundation of modern industrial success. Calculate your downtime exposure today, pilot on high-value assets, and partner with a platform like Flex83 AIoT Platform that turns data into dollars. The machines are already talking—start listening before your rivals do.
.avif)

.avif)
