Connected Equipment is Only the Starting Point

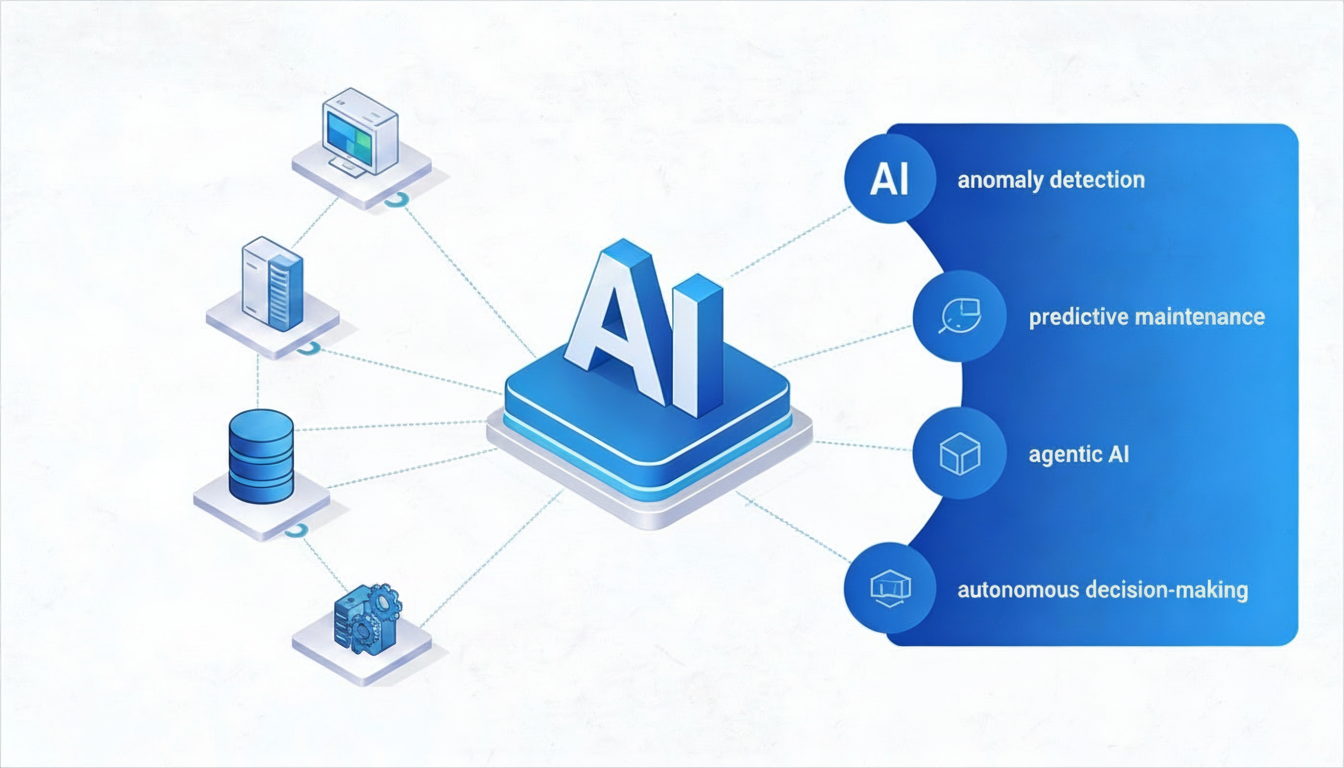
Flex83 closes the gap between your operational data and the AI outcomes your business depends on — from anomaly detection and predictive maintenance to agentic AI and autonomous decision-making.

Rows of glowing binary code digits 0 and 1 on a dark blue to black gradient background.

Most enterprises have IoT data.
Very few have turned it into intelligence.

The challenge isn't connectivity — most enterprises have already invested in sensors, gateways, and data collection. The real barrier is the distance between raw operational data and AI models that actually work in production.

AI-Ready Data. From Day One.

  • Unified data lineage across OT/IT/IoT/ET systems

  • Dynamic data mapping and transformation without custom scripting

  • Digital twin context layer to model relationships between assets, systems, and processes

Cortex AI chat interface showing an execution plan for cleaning data and saving to a new table with user approval.

Predictive Intelligence. Across Every Asset.

  • PdM models: unplanned downtime reduced by up to 50%

  • Maintenance cost reduction of 18–25% with predictive analytics

  • Pre-built templates deployable across heterogeneous asset fleets

Dashboard showing regression model run languid-dove-852 with MAE 951.6%, MSE 16921.9%, RMSE 1300.8%, and R2 score 97.4%.

Operationalize AI — Not Just Experiment with It.

  • Live model inferencing on streaming IoT data

  • Bring-your-own ML toolchain: Python, R, SageMaker, Azure ML

  • Automated action triggers from model outputs — alerts, RPCs, webhooks, workflows

Flex83 ML Studio interface showing workspace McDonald's Smart IoT with algorithm selection and AutoML options.

Agentic AI for Autonomous Operations.

  • Agentic AI and LLM orchestration layer built into the platform

  • Decision latency reduced by 40–60% with AI-driven visibility and automation

  • Fully governed AI operations with audit trails and override controls

Table listing five integrations with their status showing running and two with failed tasks and a detected issues warning.

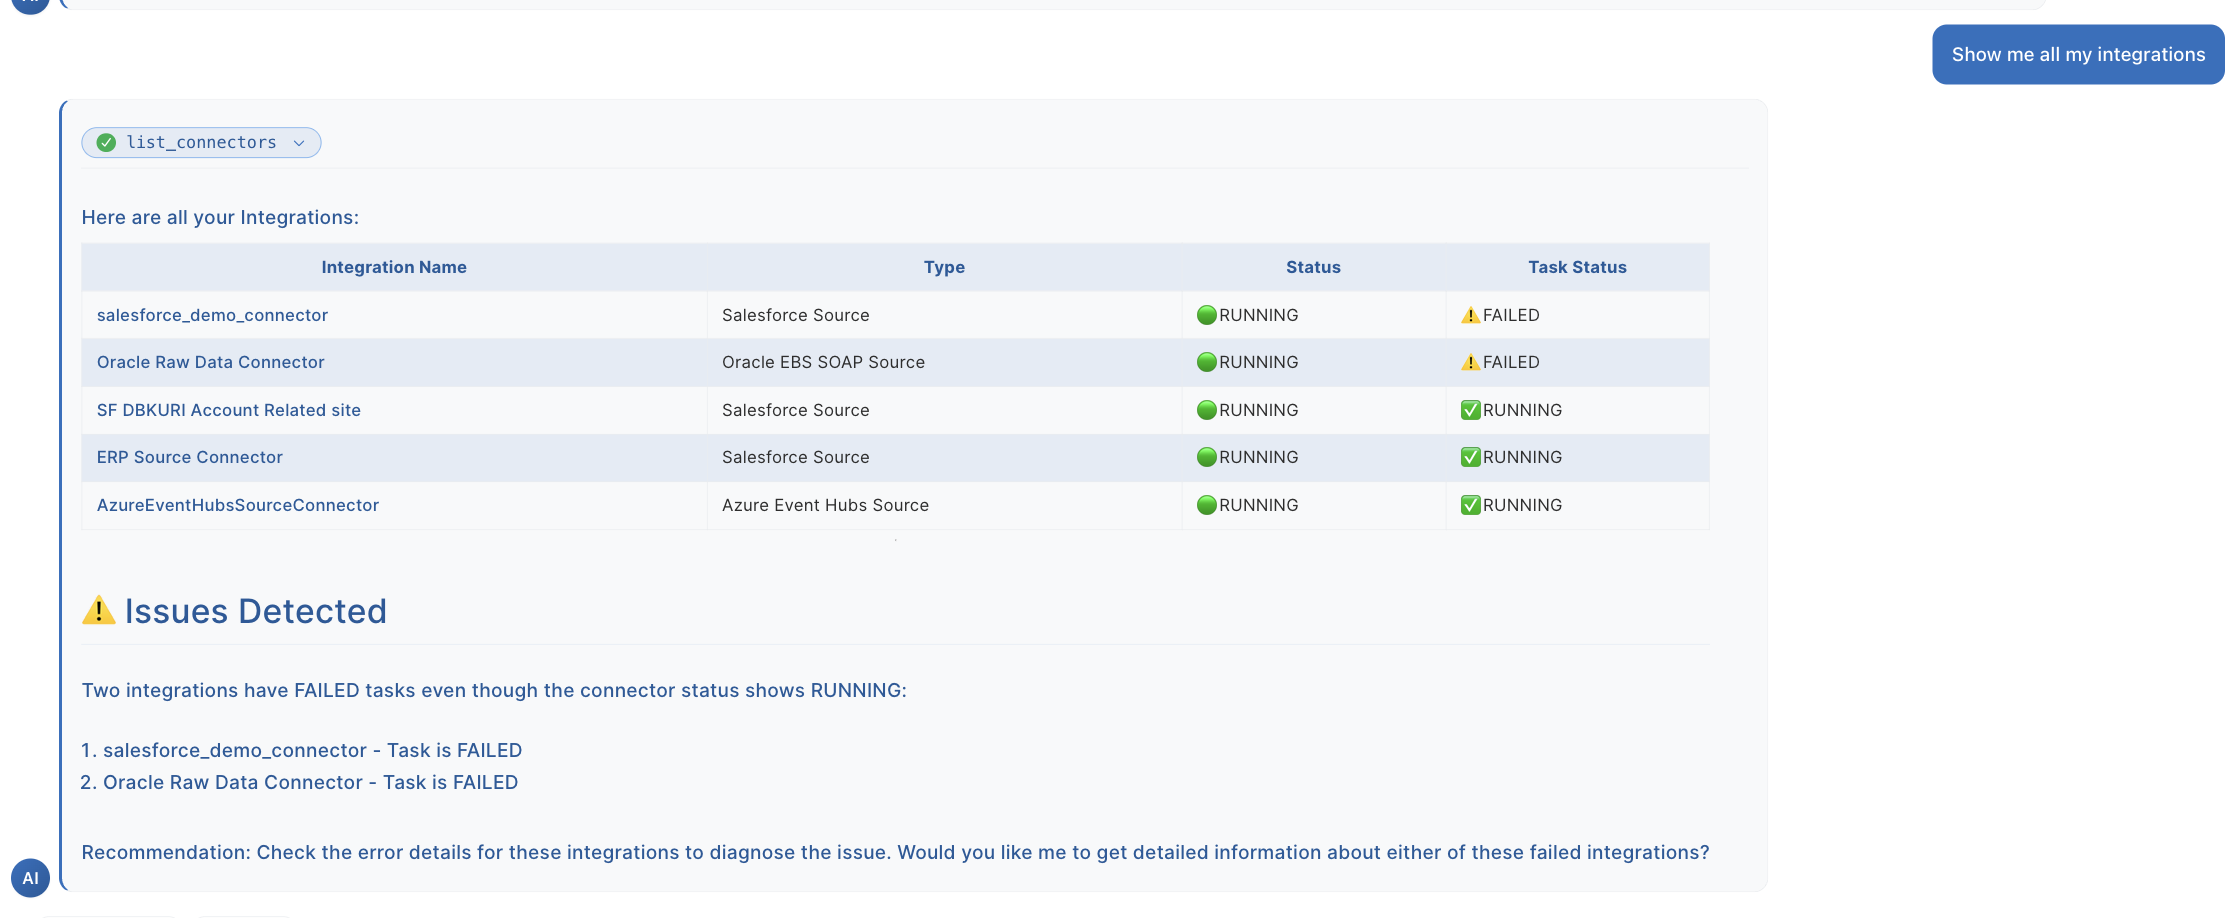
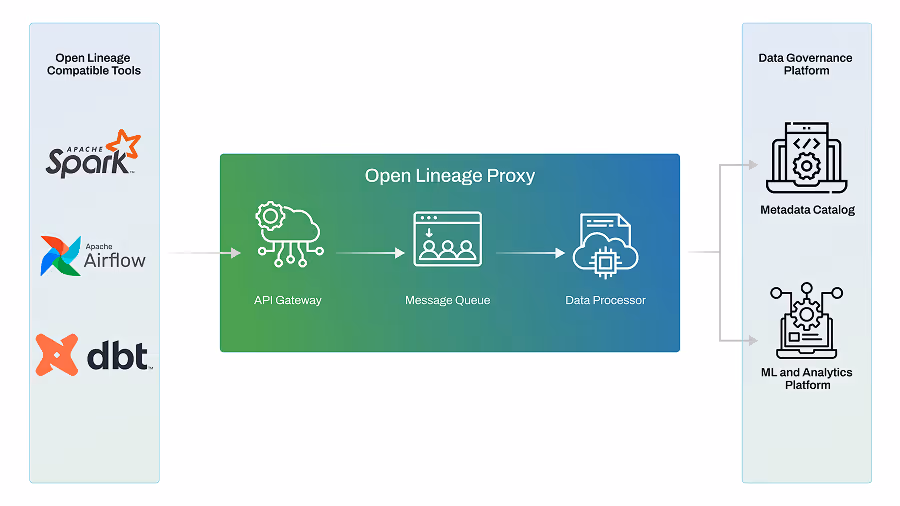
Pre-built connectors bridge fragmented IT and OT systems, ensuring real-time data ingestion and protocol translation across all stakeholders.

IoT Connectivity Metrics dashboard showing asset statuses, total assets, messages received, and bytes received.

Organize data and physical assets, providing real-time visibility, automated mapping, and streamlined operational control.

Data profiling dashboard showing 17,856 total rows, 134 columns, 0 duplicate rows, and 51.4% data quality score.

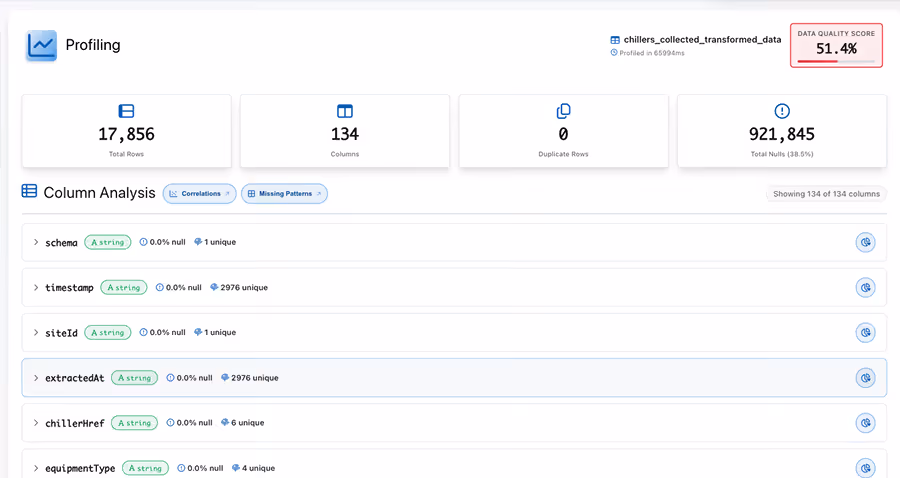
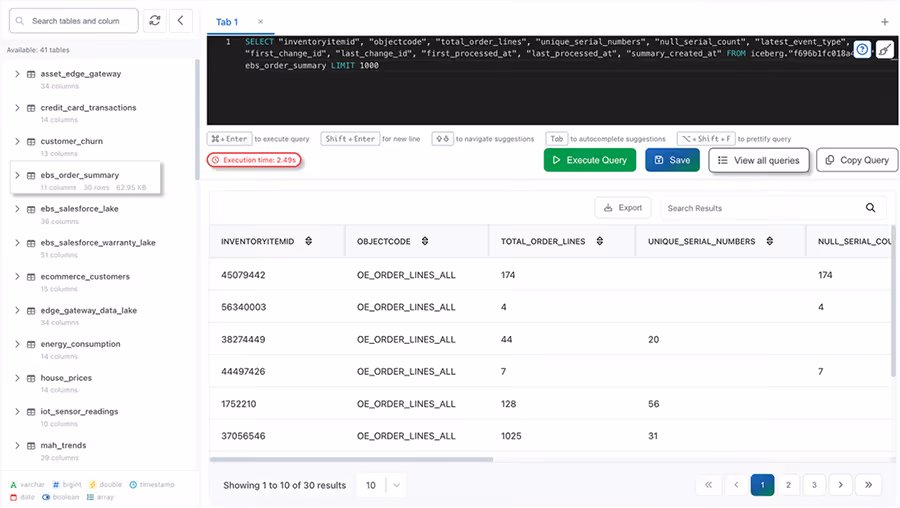
Automated profiling tags and indexes incoming data on the fly, creating a searchable, lineage-tracked repository that accelerates secure data discovery.

SQL query interface displaying a query selecting order summary data and a results table with inventory IDs and order details.

Lakehouse architecture unifies operational, analytical, and historical IoT data for seamless policy enforcement and scalable data storage.

Visualize how raw edge data evolves into actionable insight. Track provenance, see dependencies, and comply with every audit step.

50%

Reduction in unplanned downtime

40–60%

Reduction in decision latency

3–5×

ROI from real-time data analytics