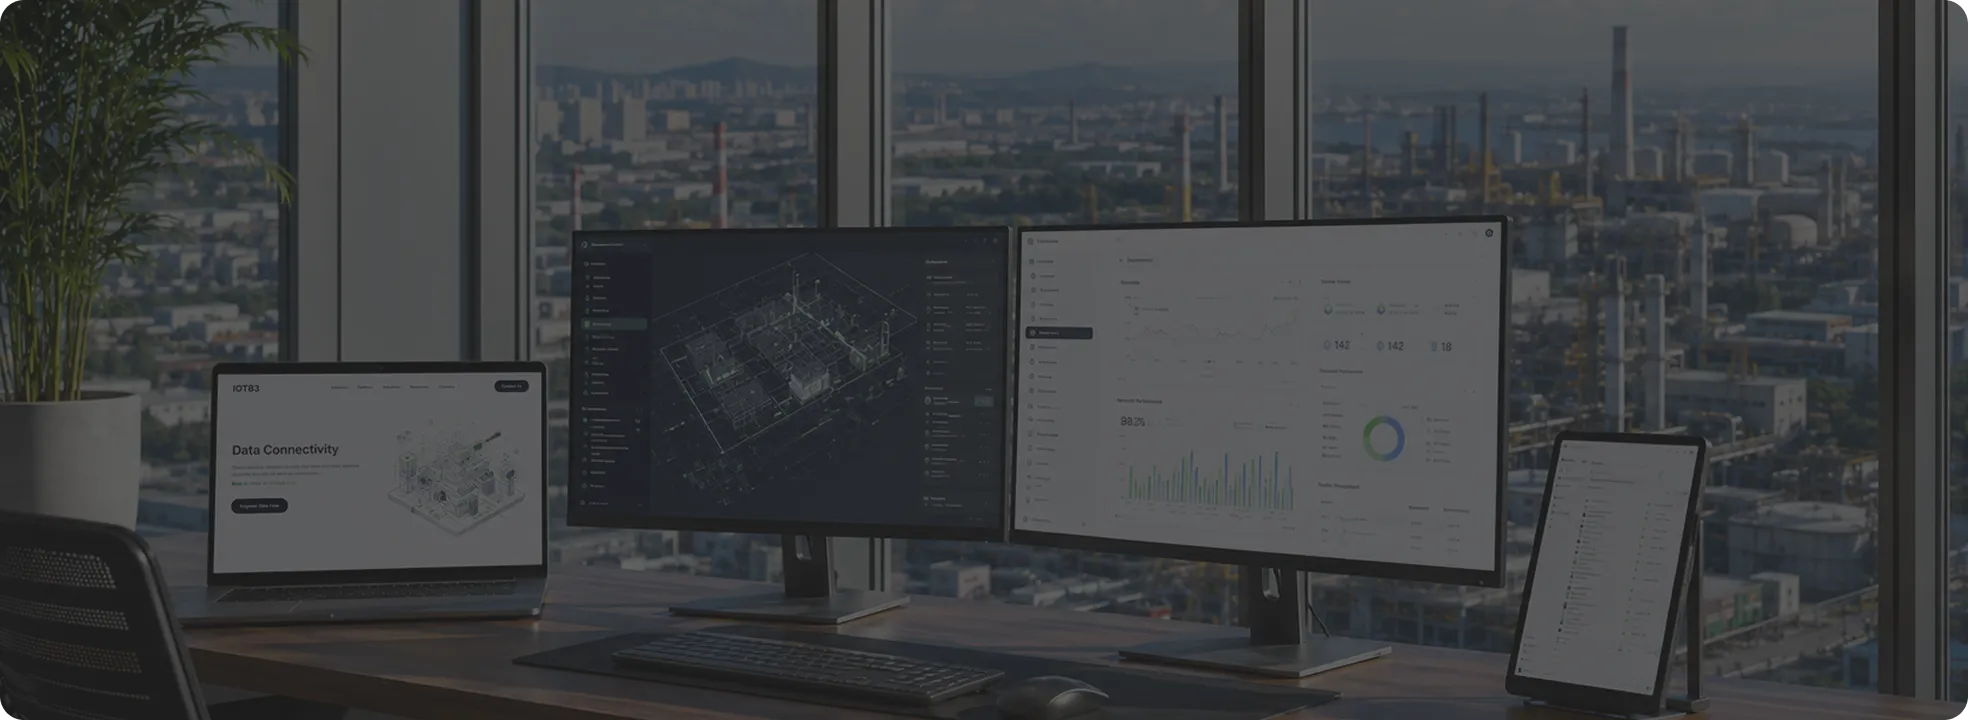
Data Visualization Platform
Build the Right View for Every Data Need
Turn operational data into interactive dashboards, reusable visualizations, embedded experiences, and fully custom applications. Use Flex83 to build each experience from the same data and queries.















Visualization Complexity Grows With Every New Use Case
Operational data can support dashboards, shared views, reusable components, and complete applications. Without a data visualization platform to build and manage those experiences from one place, visualization work quickly becomes repetitive, fragmented, and difficult to scale.
Inconsistent views create inconsistent metrics
Teams recreate the same KPIs, charts, and visual components across dashboards, often with differences in formatting or underlying logic. A change to one metric then requires teams to track down and update every version.
Sharing data creates access and security overhead
Customers, partners, and other applications may need one specific dashboard without access to the wider platform. Delivering that limited view can require separate credentials, visualization tools, or custom integration work.
Custom experiences create a separate technology stack
A customer portal or purpose-built operational application goes beyond standard dashboard layouts. Building it separately introduces another environment for hosting, deployment, security, and ongoing maintenance.
Build your view from the same governed data
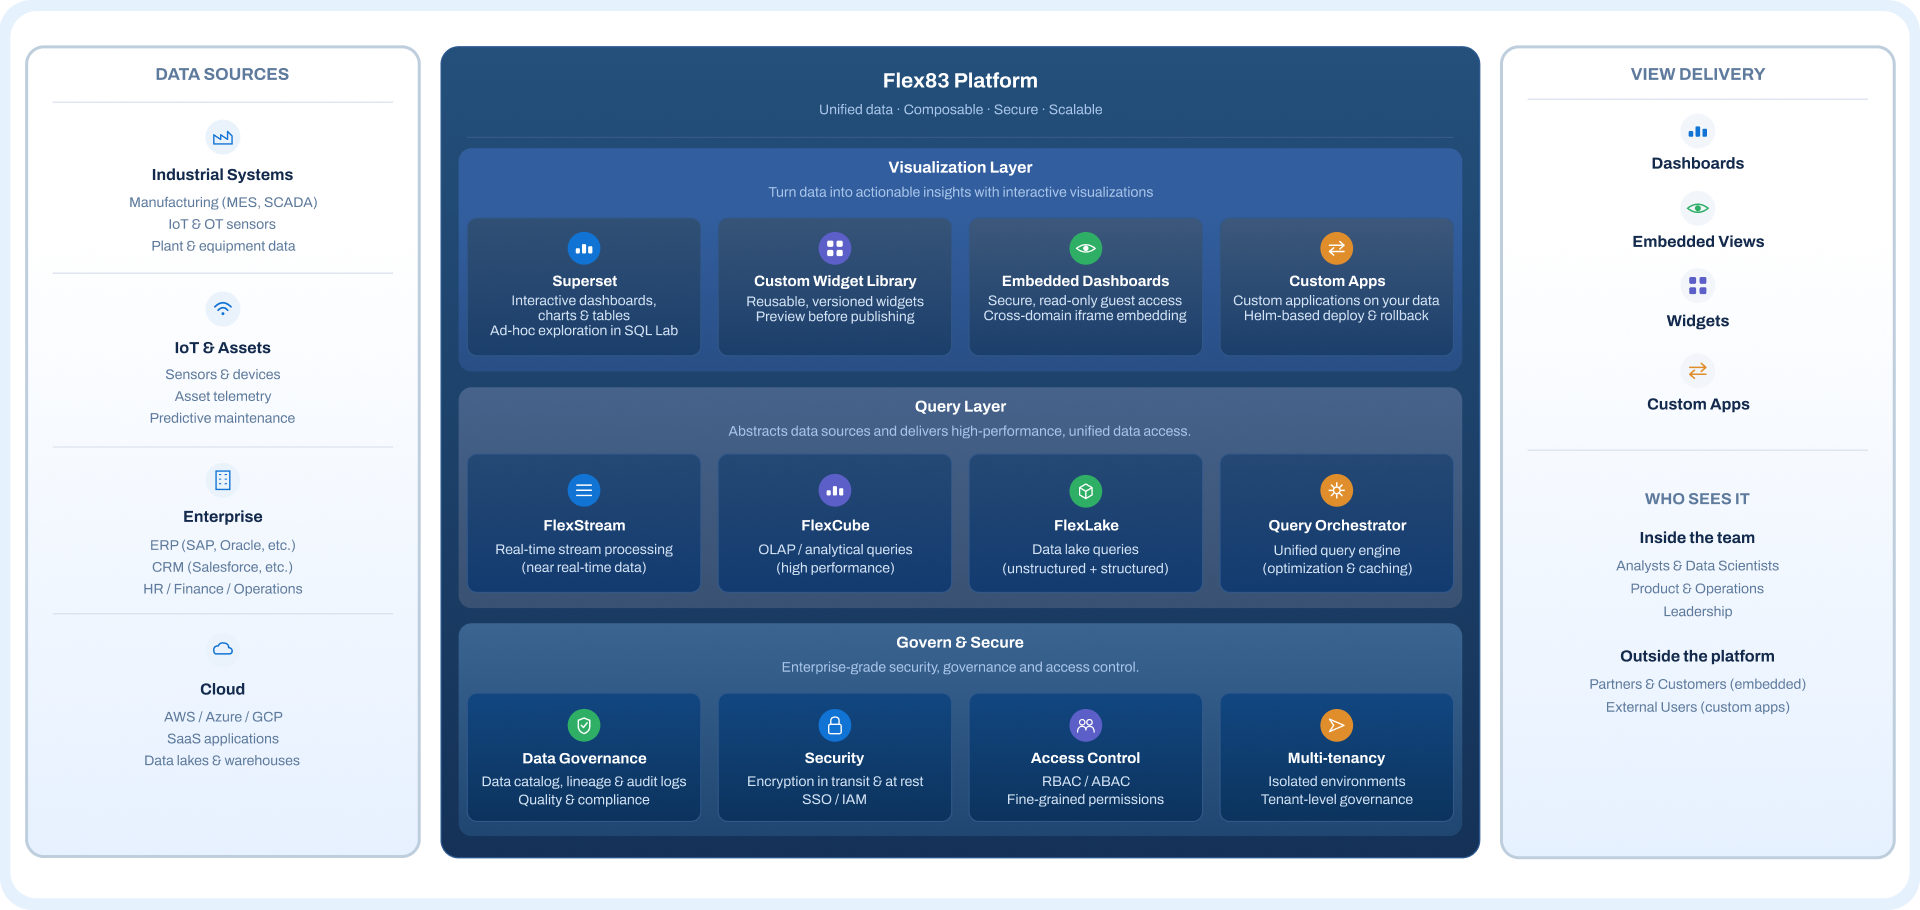
Bring dashboards, widgets, embedded views, and custom applications together on Flex83's data visualization platform, with the same queries feeding every one of them.
Core Capabilities
Get a dashboard, a reusable widget, an embeddable view, or a fully custom application, all from the same platform queries, managed from one place.
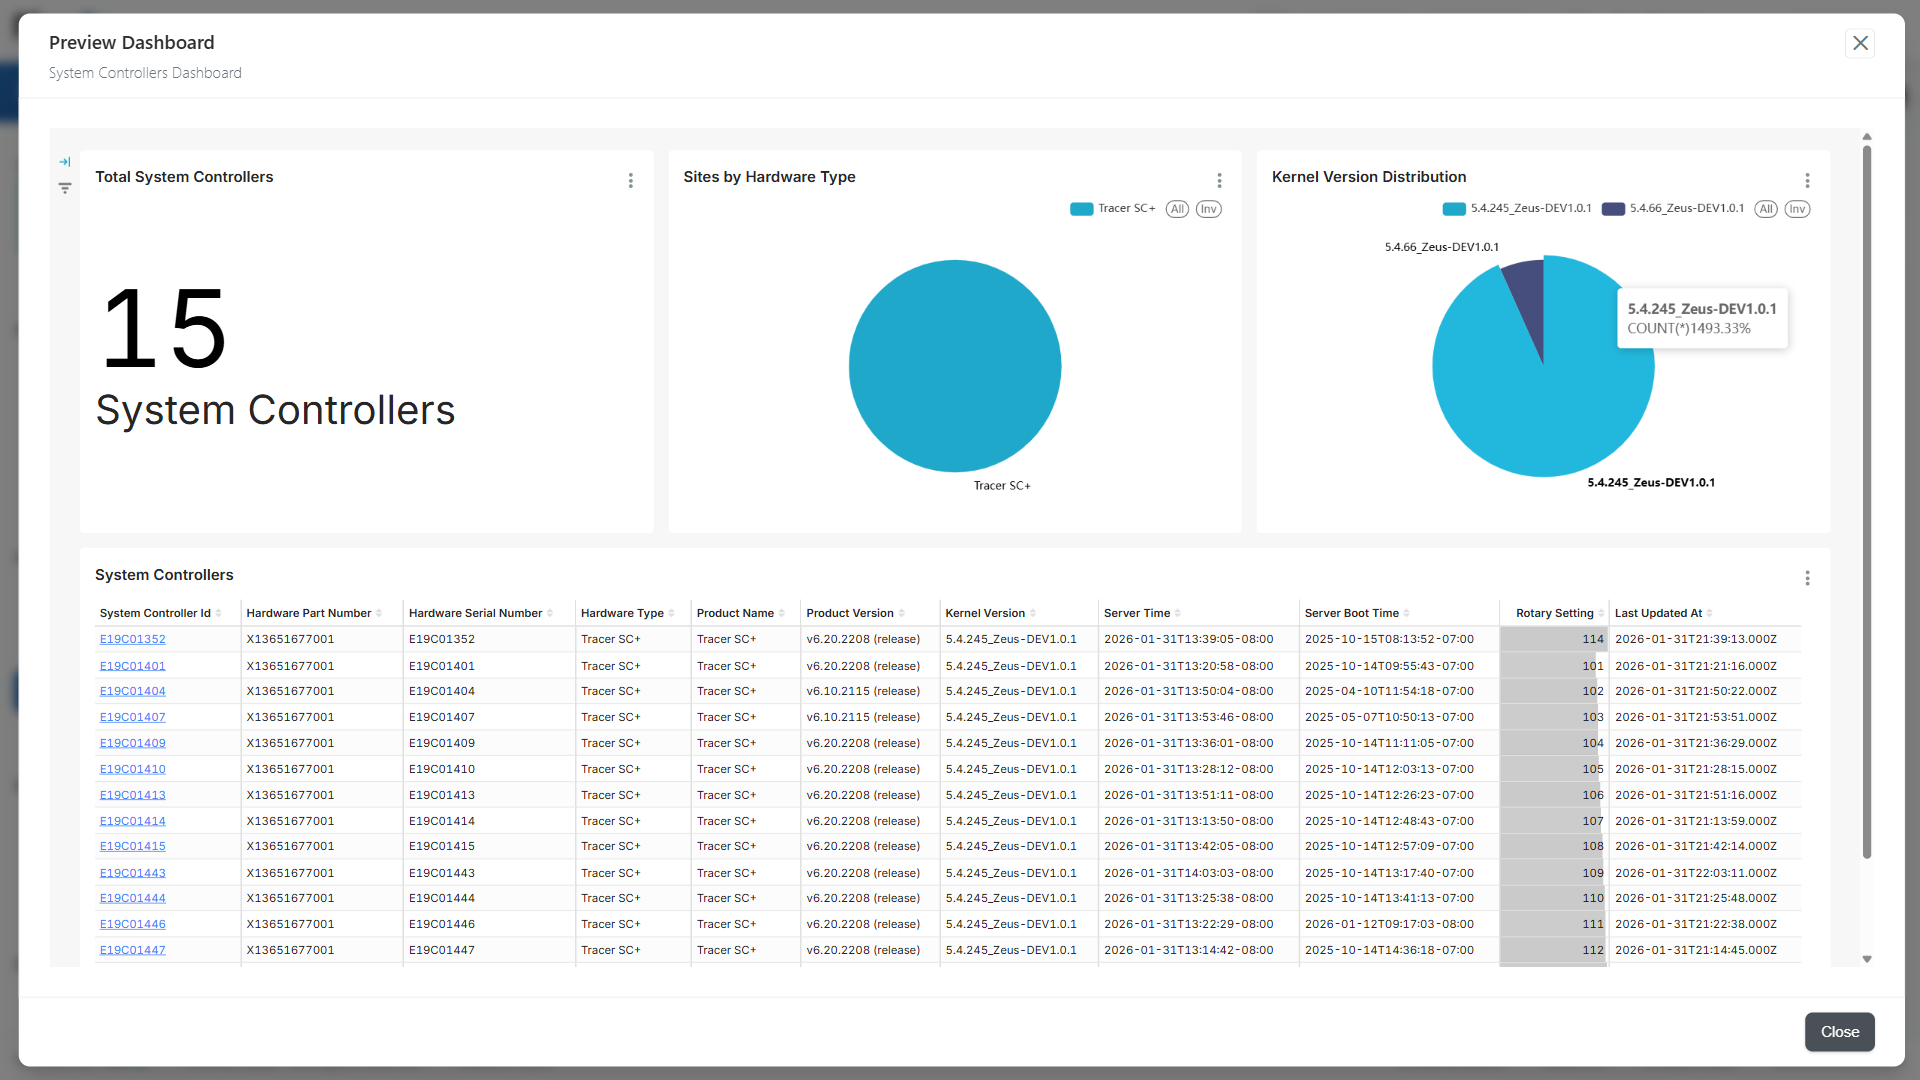
Explore live data through interactive dashboards
Dashboards turn any Flex83 query into a live view your team can open and explore on its own, with nothing separate to log into.
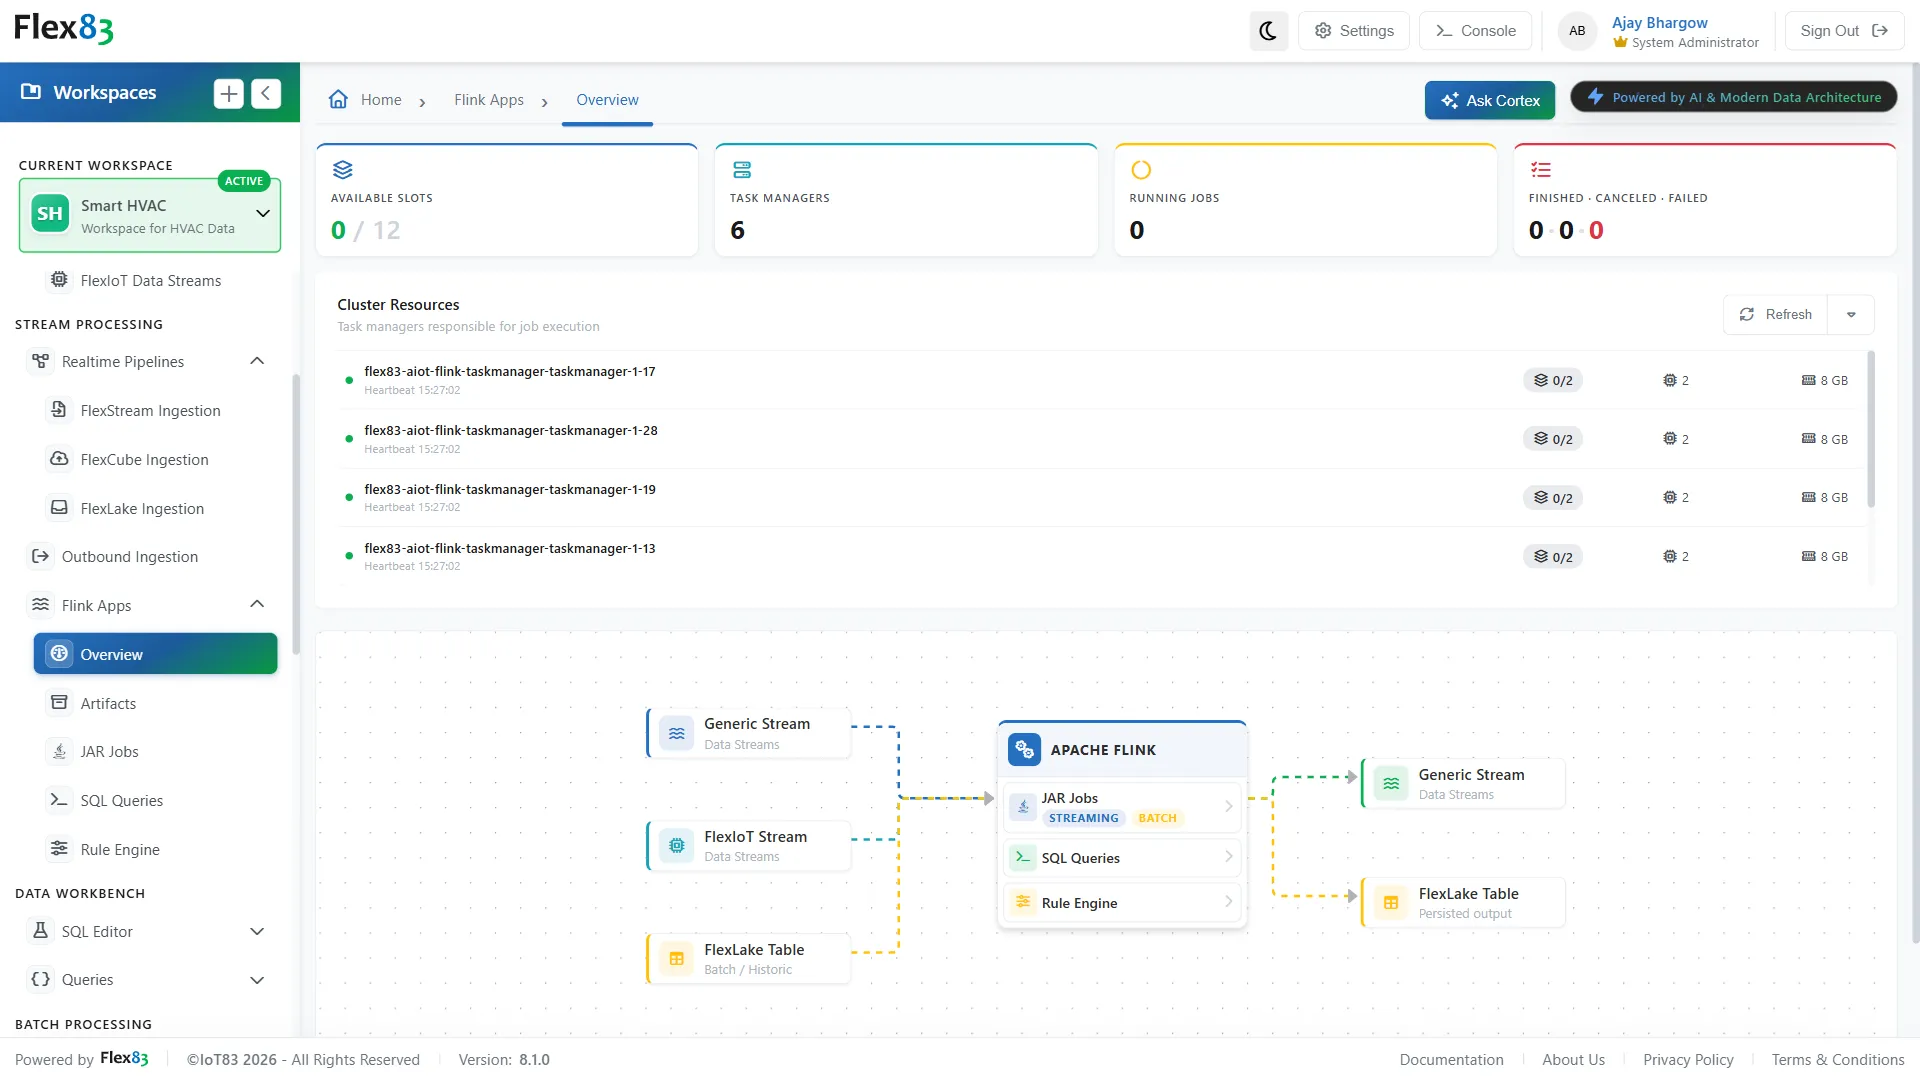
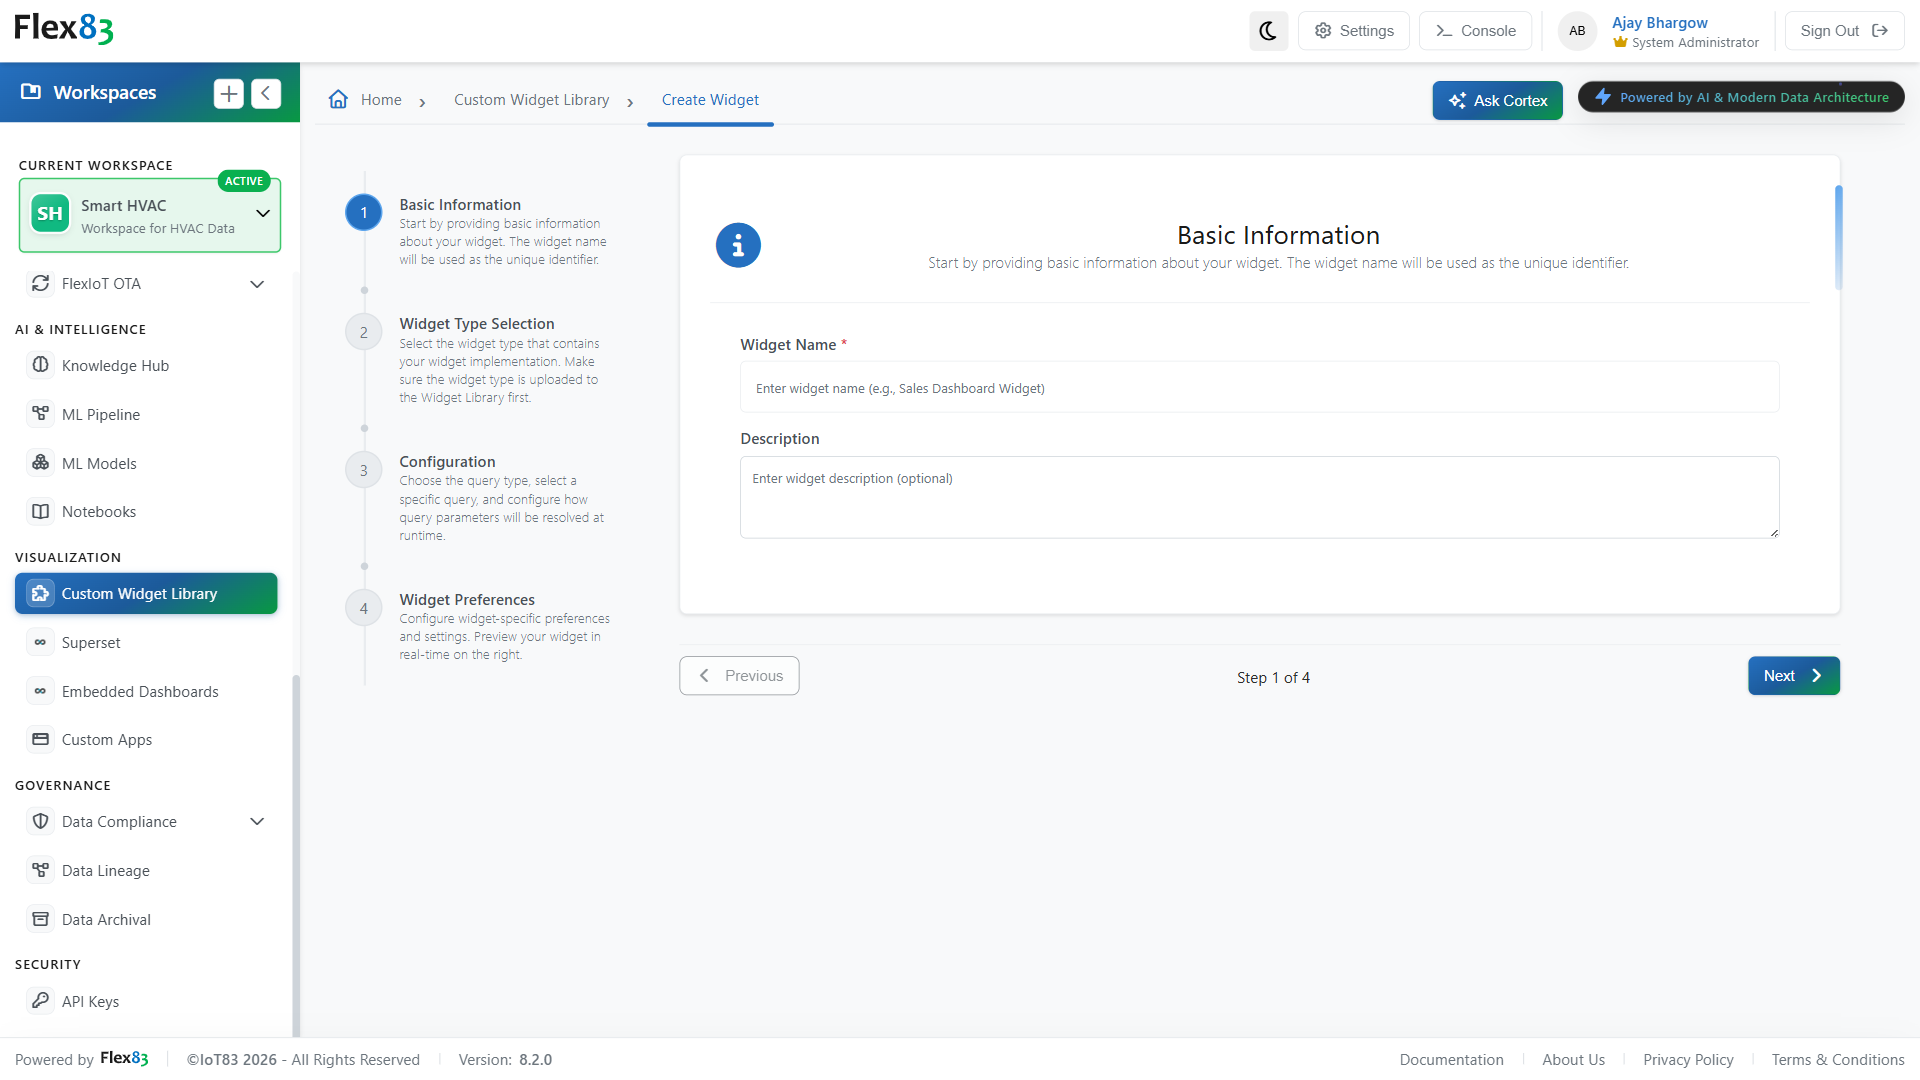
Turn queries into reusable visual components
The Custom Widget Library lets you build a chart or metric card once, connect it to your data, and reuse it anywhere it's needed instead of rebuilding it for every new dashboard or application.
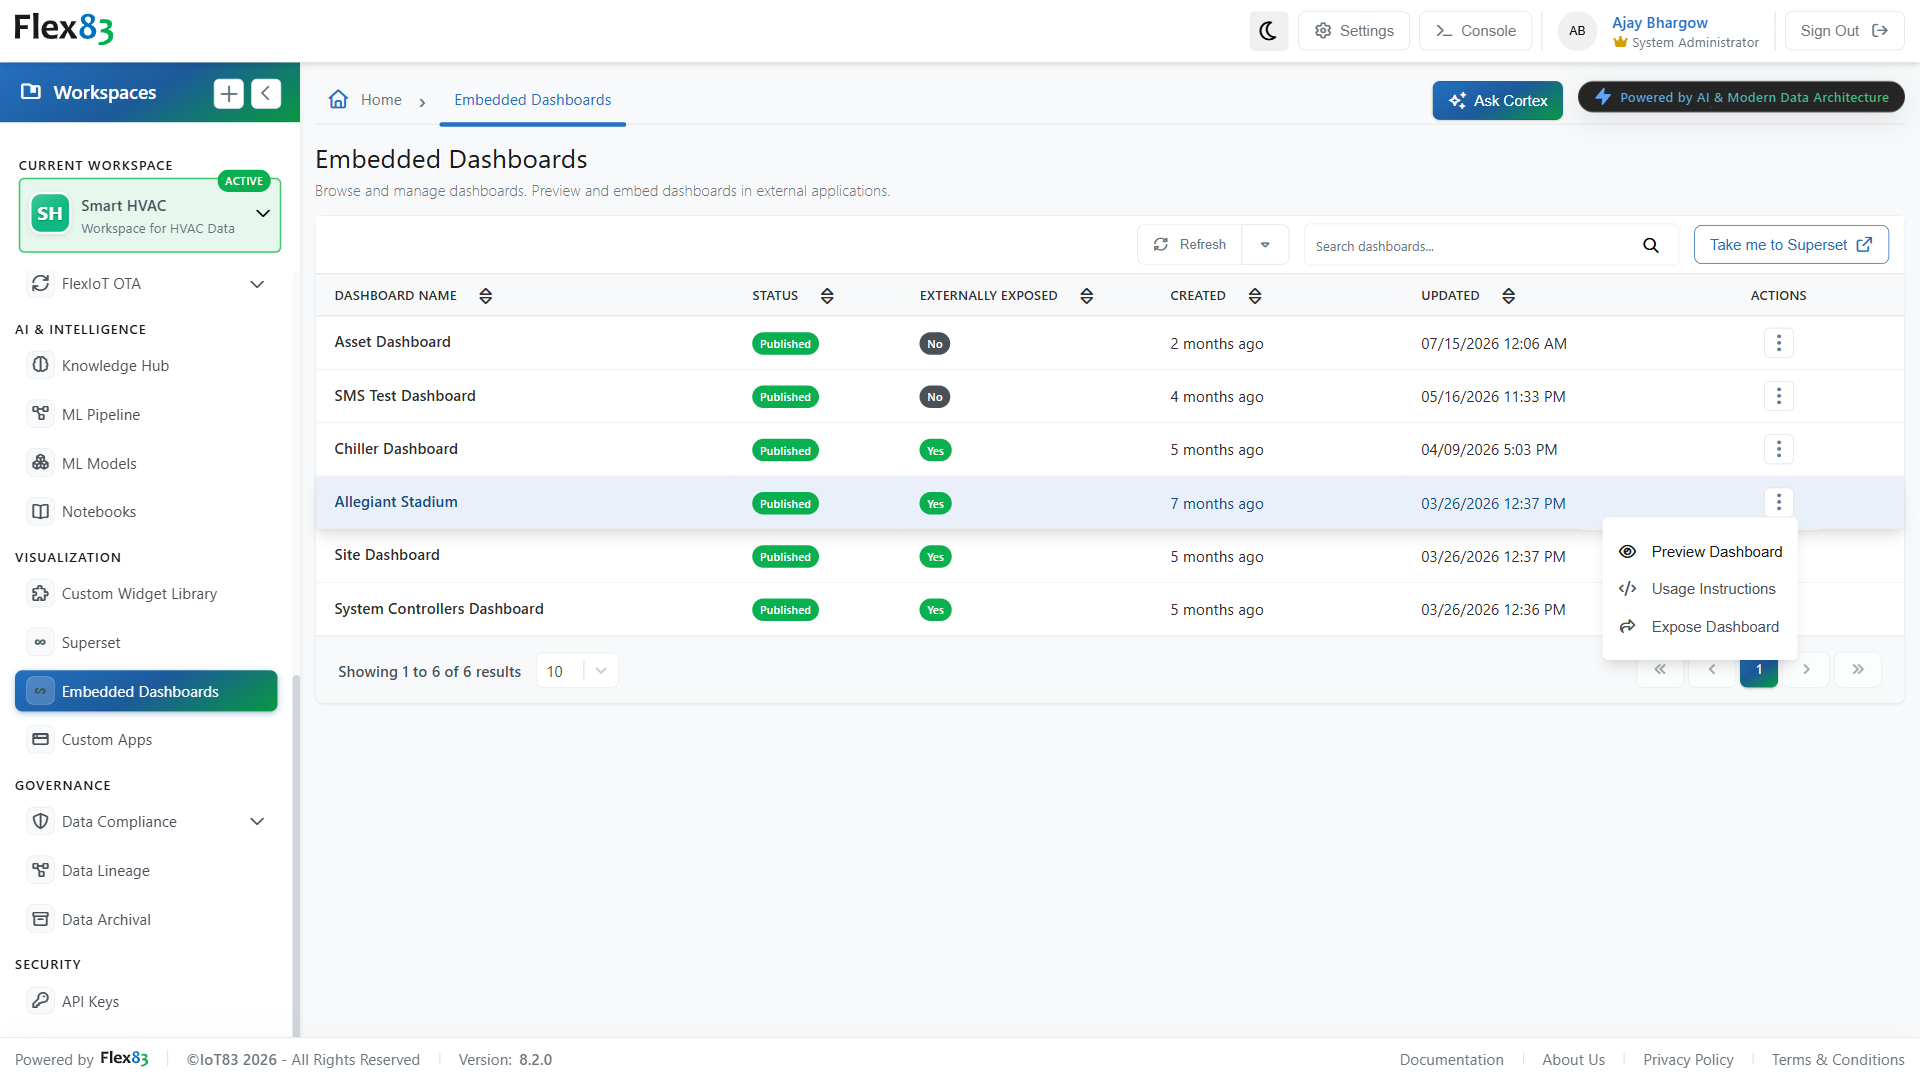
Embed dashboards with controlled access
Embedded Dashboards lets you share a specific dashboard with customers, partners, or an outside application, without giving them access to the rest of Flex83.

Build a complete application around your data
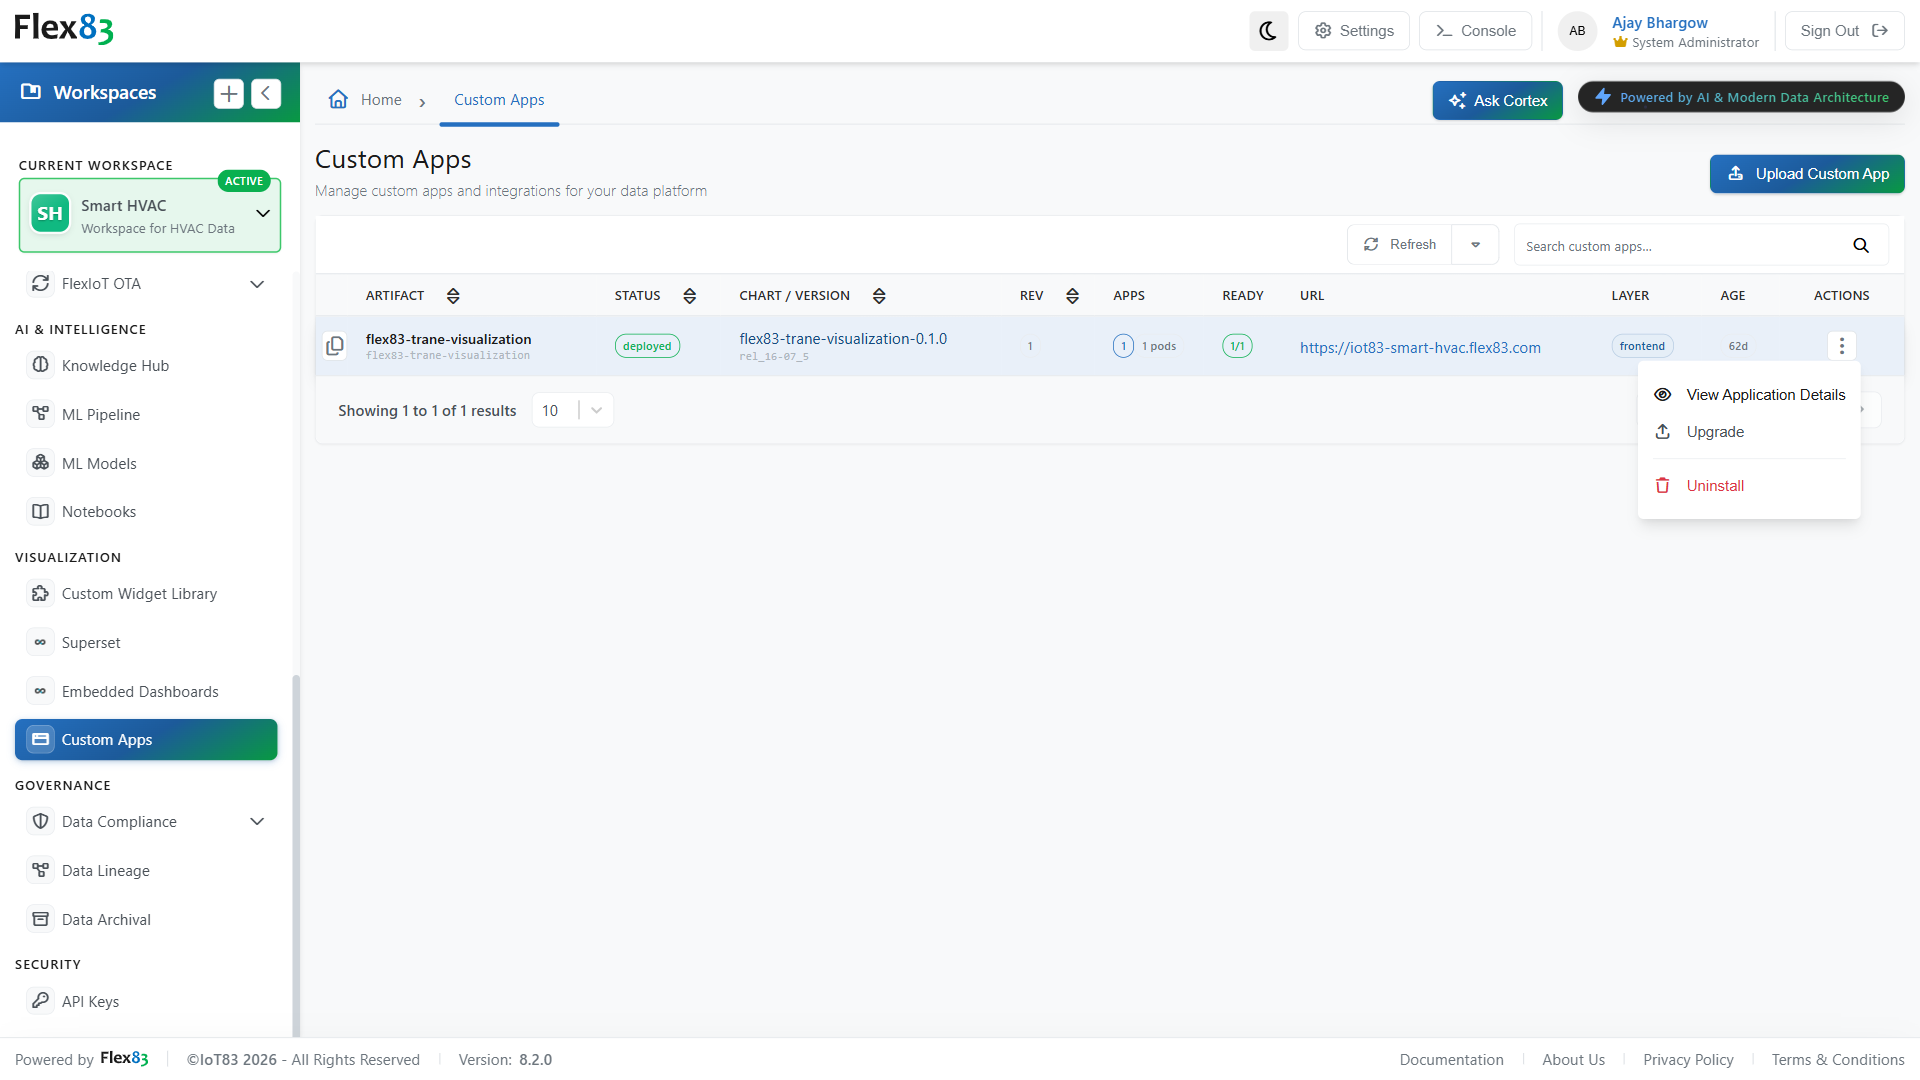
Some operational experiences need more than dashboards and widgets. Custom Apps lets you deploy a fully packaged application directly within Flex83, built around the workflow instead of fitting into a predefined layout.
How Flex83 Supports Data Visualization Across Various Operations
From operational monitoring to customer-facing applications, Flex83 provides different ways to turn connected data into usable views.
Monitor asset performance
Bring load, voltage, energy consumption, and other asset metrics into a single operational dashboard. Teams can monitor current conditions and track performance without working through individual records.
Track connected devices
Combine live sensor readings with device status in a single view. Temperature, humidity, pressure, and online/offline status can sit together for faster fleet monitoring.
Deliver customer-facing views
Give customers and partners a dedicated operational experience instead of exposing the underlying platform. Custom Apps turns that experience into a fully branded application of its own.
Track business performance
Bring business metrics into the same visualization environment as operational data. Revenue trends, user activity, and KPIs can be presented through dashboards alongside the data teams already monitor.
Proven in production
One IoT83 deployment already runs on exactly this: multi-instrument data, unified into a single visual window.
A single window for multi-instrument data, replacing manual, fragmented reporting.
A test and measurement equipment provider needed one platform for millions of instrument data points, but engineers were consolidating readings by hand, missing real-time insight, and slowed by manual, fragmented reporting. IoT83 built a platform for multi-instrument data correlation, aggregation, and visualization, all in a single window, replacing that manual process entirely.
Frequently Asked Questions
What is Flex83 data visualization?
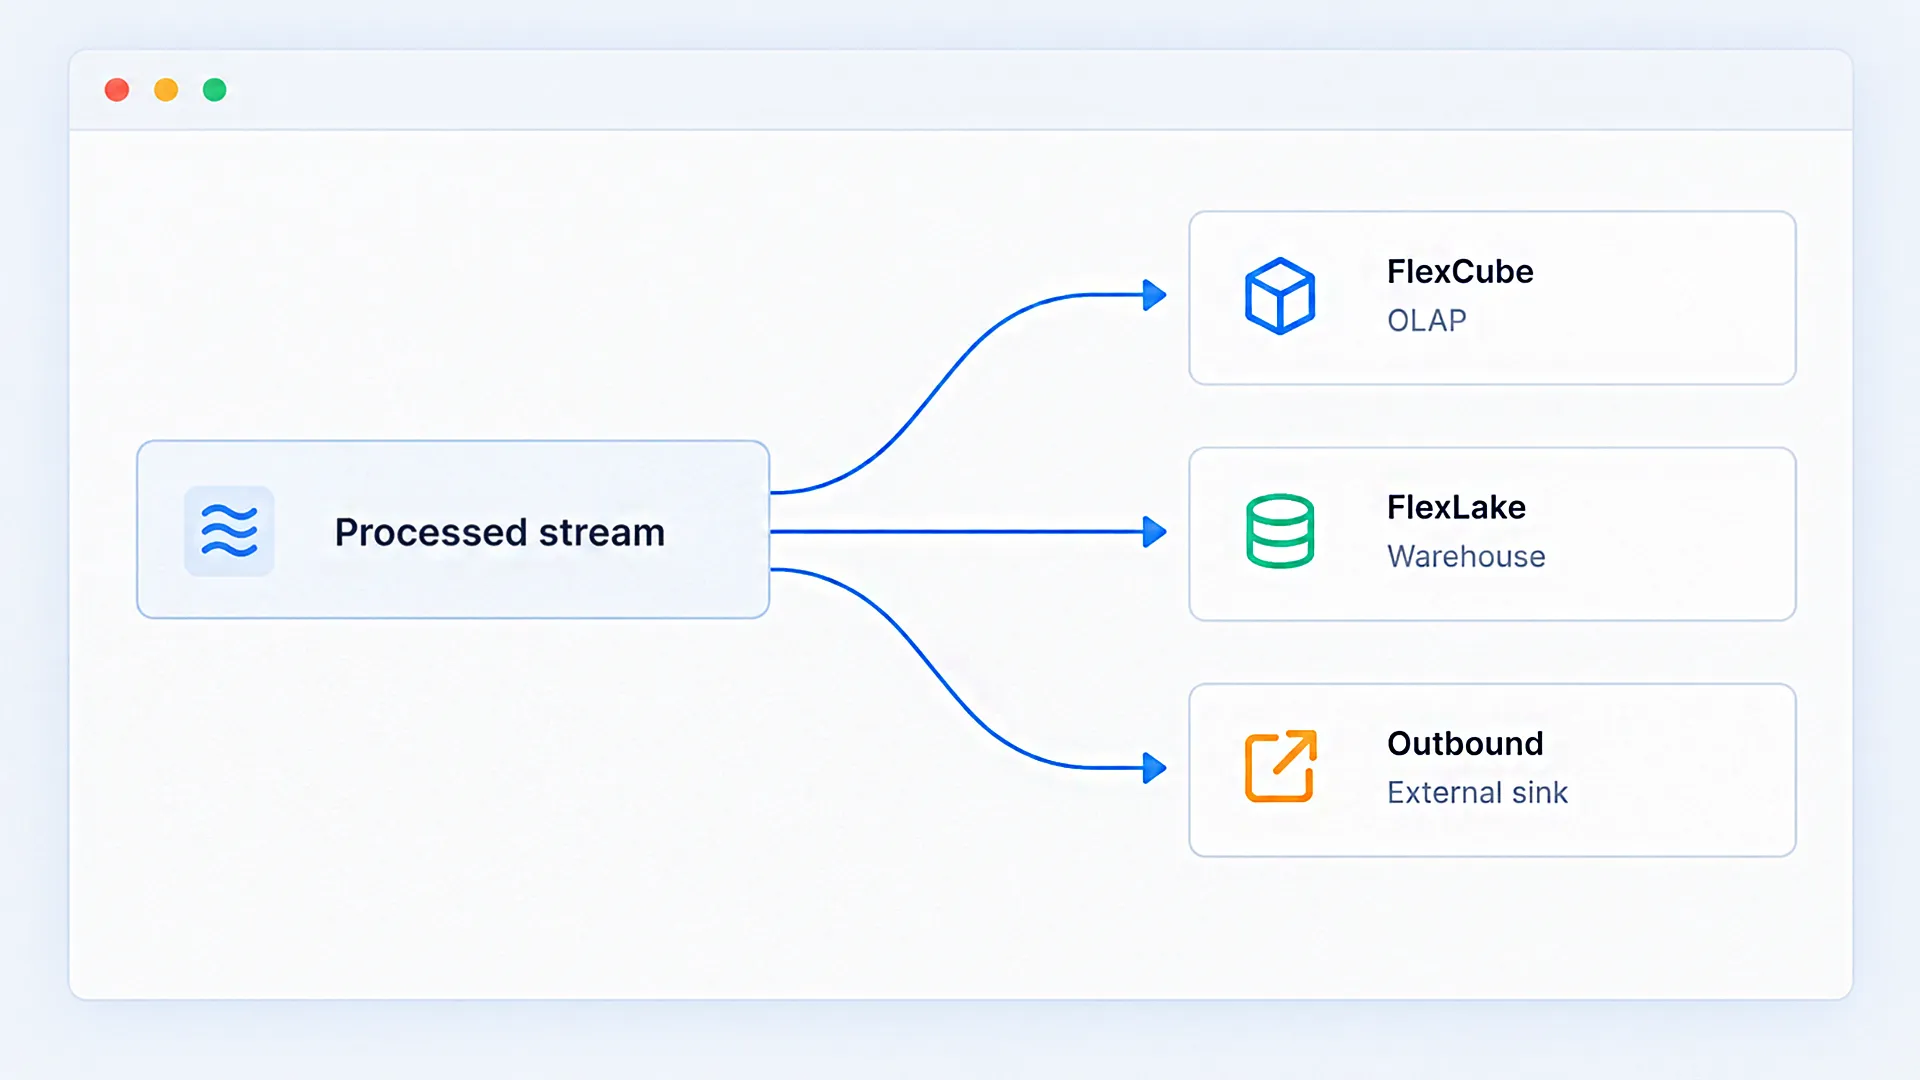
Flex83's data visualization platform turns operational data into interactive dashboards, reusable widgets, embedded views, and custom applications. These experiences can use queries from FlexStream, FlexCube, and FlexLake.
What types of data visualization does Flex83 support?
Flex83 supports interactive dashboards, charts, tables, metric cards, reusable widgets, embedded dashboards, and custom applications. Teams can choose the visualization experience based on how they need to explore, share, or use operational data.
Can I build interactive dashboards with Flex83?
Yes. Flex83 includes Superset for building interactive dashboards and visualizations. Users can filter, drill down, zoom, hover for details, cross-filter charts, and work with underlying queries through SQL Lab.
Can Flex83 visualize industrial and IoT data?
Yes. Flex83 can visualize operational data from connected devices, assets, and industrial systems. Queries from FlexStream, FlexCube, and FlexLake can feed dashboards, widgets, embedded views, and custom applications.
What is an enterprise data visualization platform?
An enterprise data visualization platform helps organizations turn large and distributed data sets into dashboards, charts, reports, and other visual experiences. Flex83 connects visualization to its data and query layers so teams can explore, share, and build on operational data within one platform.
Can Flex83 be used to visualize real-time data?
Yes. Flex83 can use FlexStream queries to support visualization of streaming operational data. Teams can present current metrics, trends, and device or asset status through dashboards and other visualization experiences.
Can Flex83 create dashboards for customers and partners?
Yes. Teams can create customer-facing visualization experiences using Embedded Dashboards, reusable widgets, or Custom Apps. Access can be scoped to the specific experience and audience.
Can Flex83 create custom data visualization applications?
Yes. Custom Apps lets teams deploy packaged applications directly within Flex83. Each application can have its own URL and isolated Kubernetes environment, allowing teams to build experiences beyond standard dashboards.
Can Flex83 visualize data from multiple sources?
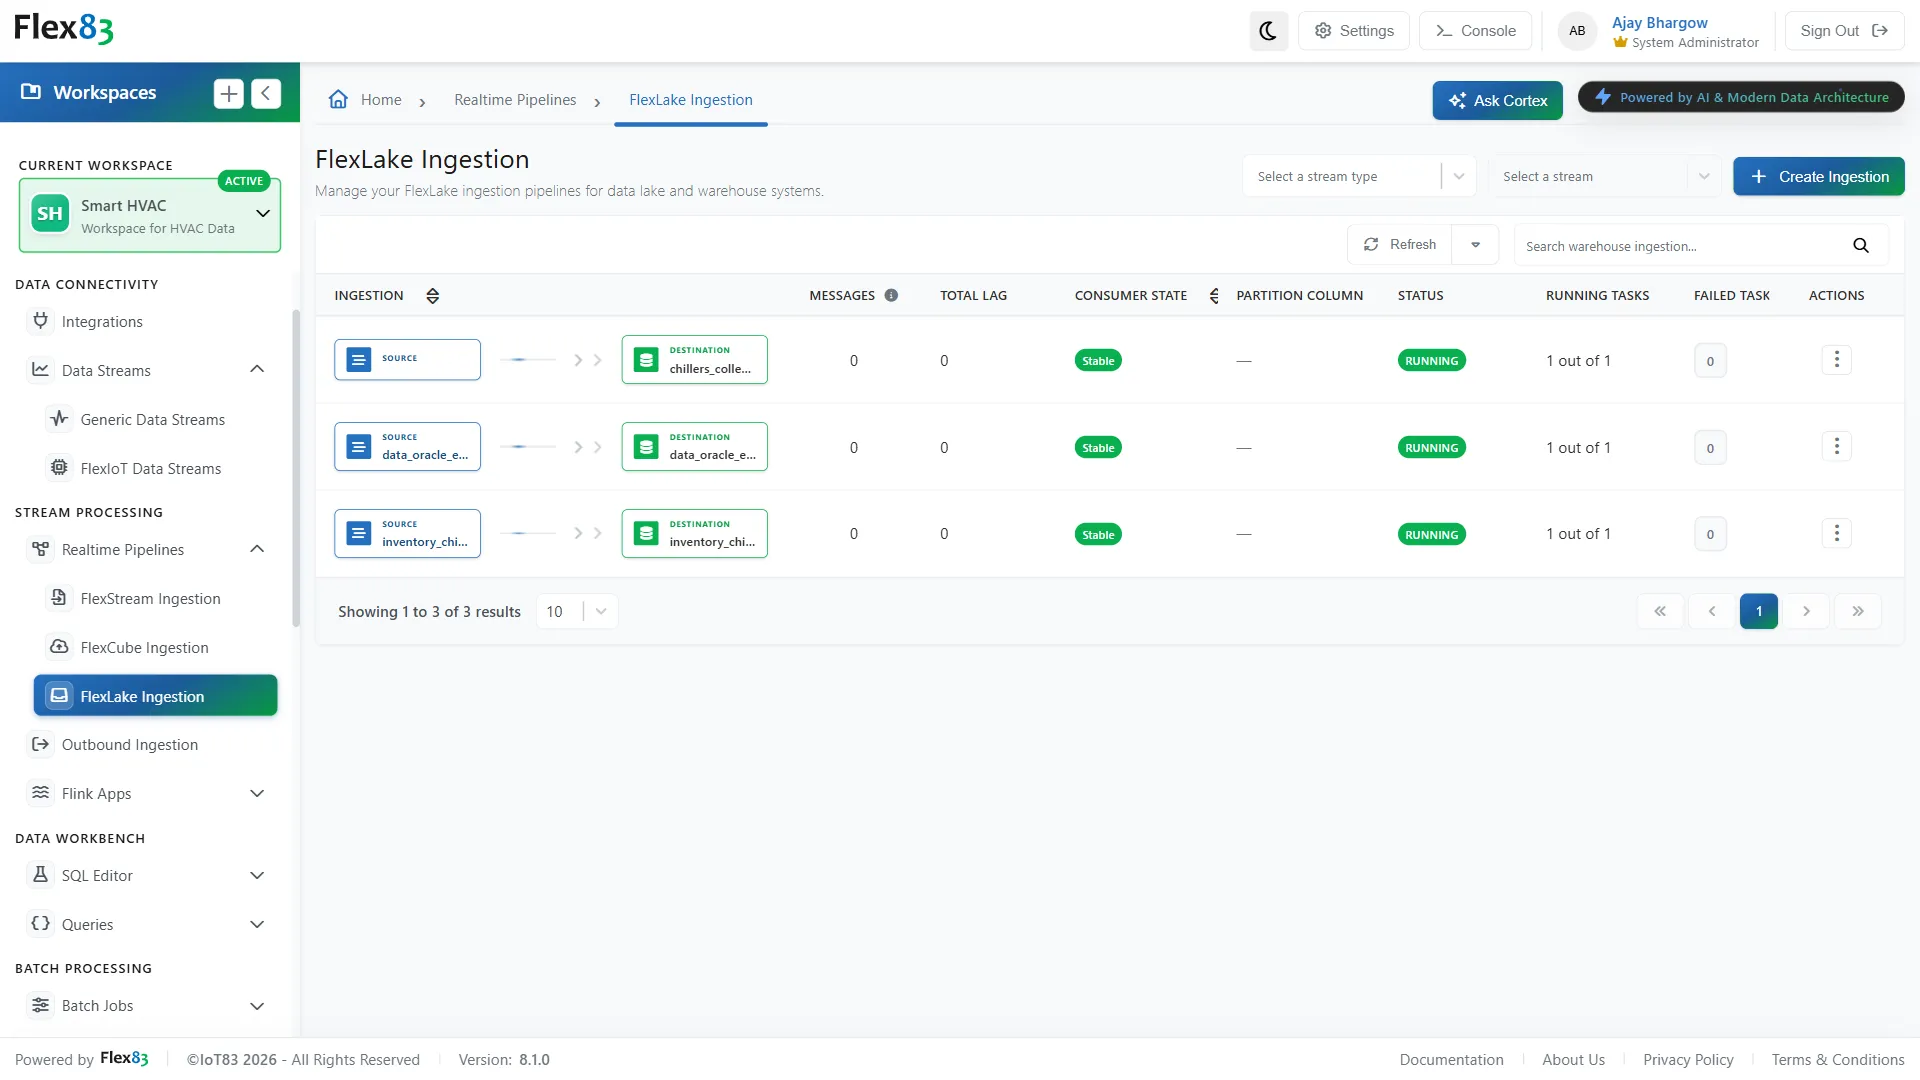
Yes. Flex83 provides query and data layers including FlexStream, FlexCube, and FlexLake that can support different visualization experiences. This allows teams to work with operational data across different storage and processing layers within the same platform.
Turn Operational Data Into Decisions
From dashboards your team checks daily to portals your customers log into, every view stays connected to the same data. Start building yours.