Observability
Get end-to-end visibility into platform behavior
Track platform health, follow requests across microservices, and investigate problems with metrics, traces, logs, and audit records.











Monitor every layer of platform activity
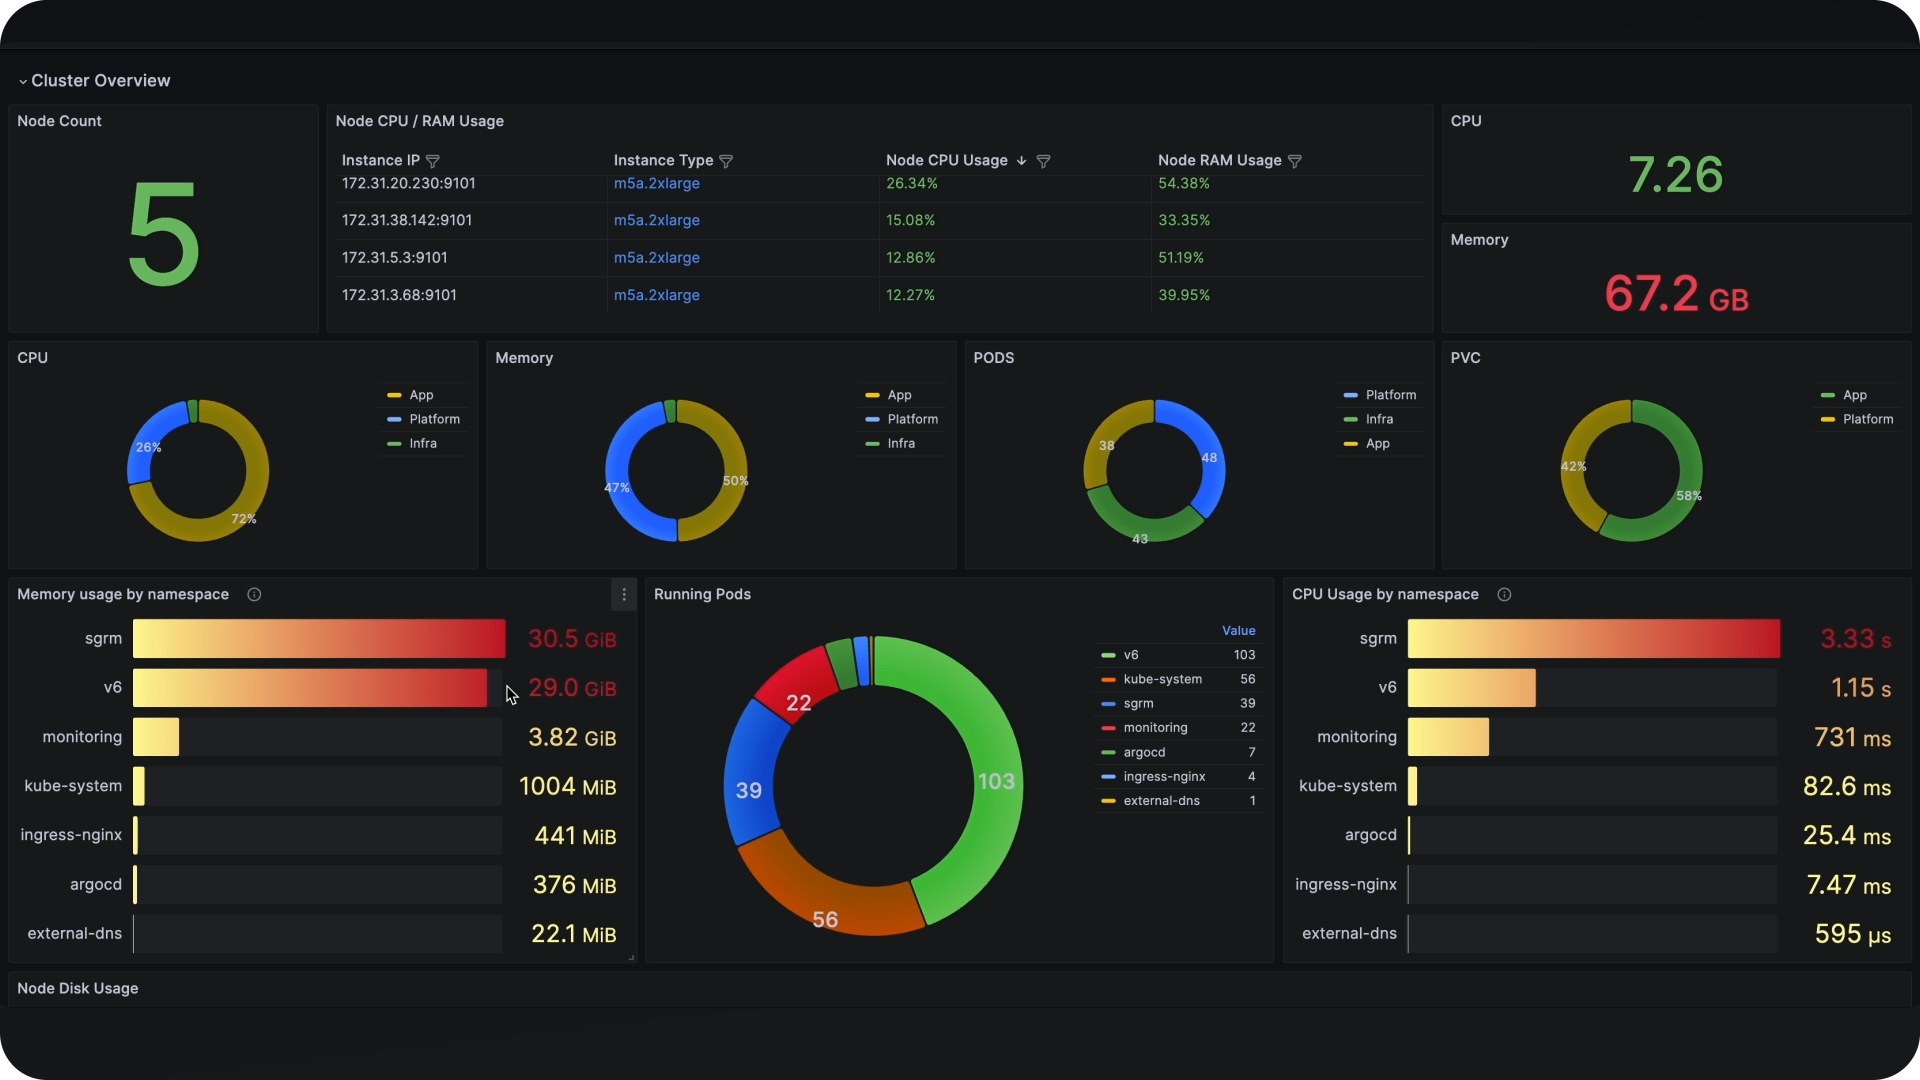
Flex83 brings metrics, traces, logs, audit records, and health checks together to monitor services, investigate failures, and track platform activity.
Metrics
See performance trends, resource usage, throughput, latency, and errors over time.
Traces
Follow requests across services to understand dependencies, latency, and failure points.
Logs
Inspect the events and errors behind a request, with trace and span IDs for direct correlation.
Audit logs
Track user actions across the platform with searchable records of who did what, when, and where.
Health checks
Monitor service availability and readiness across Kubernetes-managed microservices.
One observability layer across the platform
Get unified observability across services, workloads, and activity.
Core capabilities
Flex83 gives your team a complete view of platform performance, request flows, issues, and service health.
Catch performance problems with one query
Track the signals that reveal changes in performance, from throughput and latency to Kafka consumer lag and database connection pool usage, then query the exact number in PromQL instead of waiting on a dashboard.
.png)
Trace any request to the slow step
Follow a request through the microservice landscape, span by span, to pinpoint exactly where it slows down or fails.
.png)
Jump from a trace to the logs
Connect application events, errors, and stack traces to the exact request and service that generated them.

.png)
Capture every user action without manual logging
Maintain a searchable record of who did what across the platform, when it happened, and how long it took, with nothing for your team to instrument.
.png)
Kubernetes restarts unhealthy services on its own
Use health signals to confirm which services are running and ready for traffic, and let Kubernetes act on them before anyone has to.
.png)
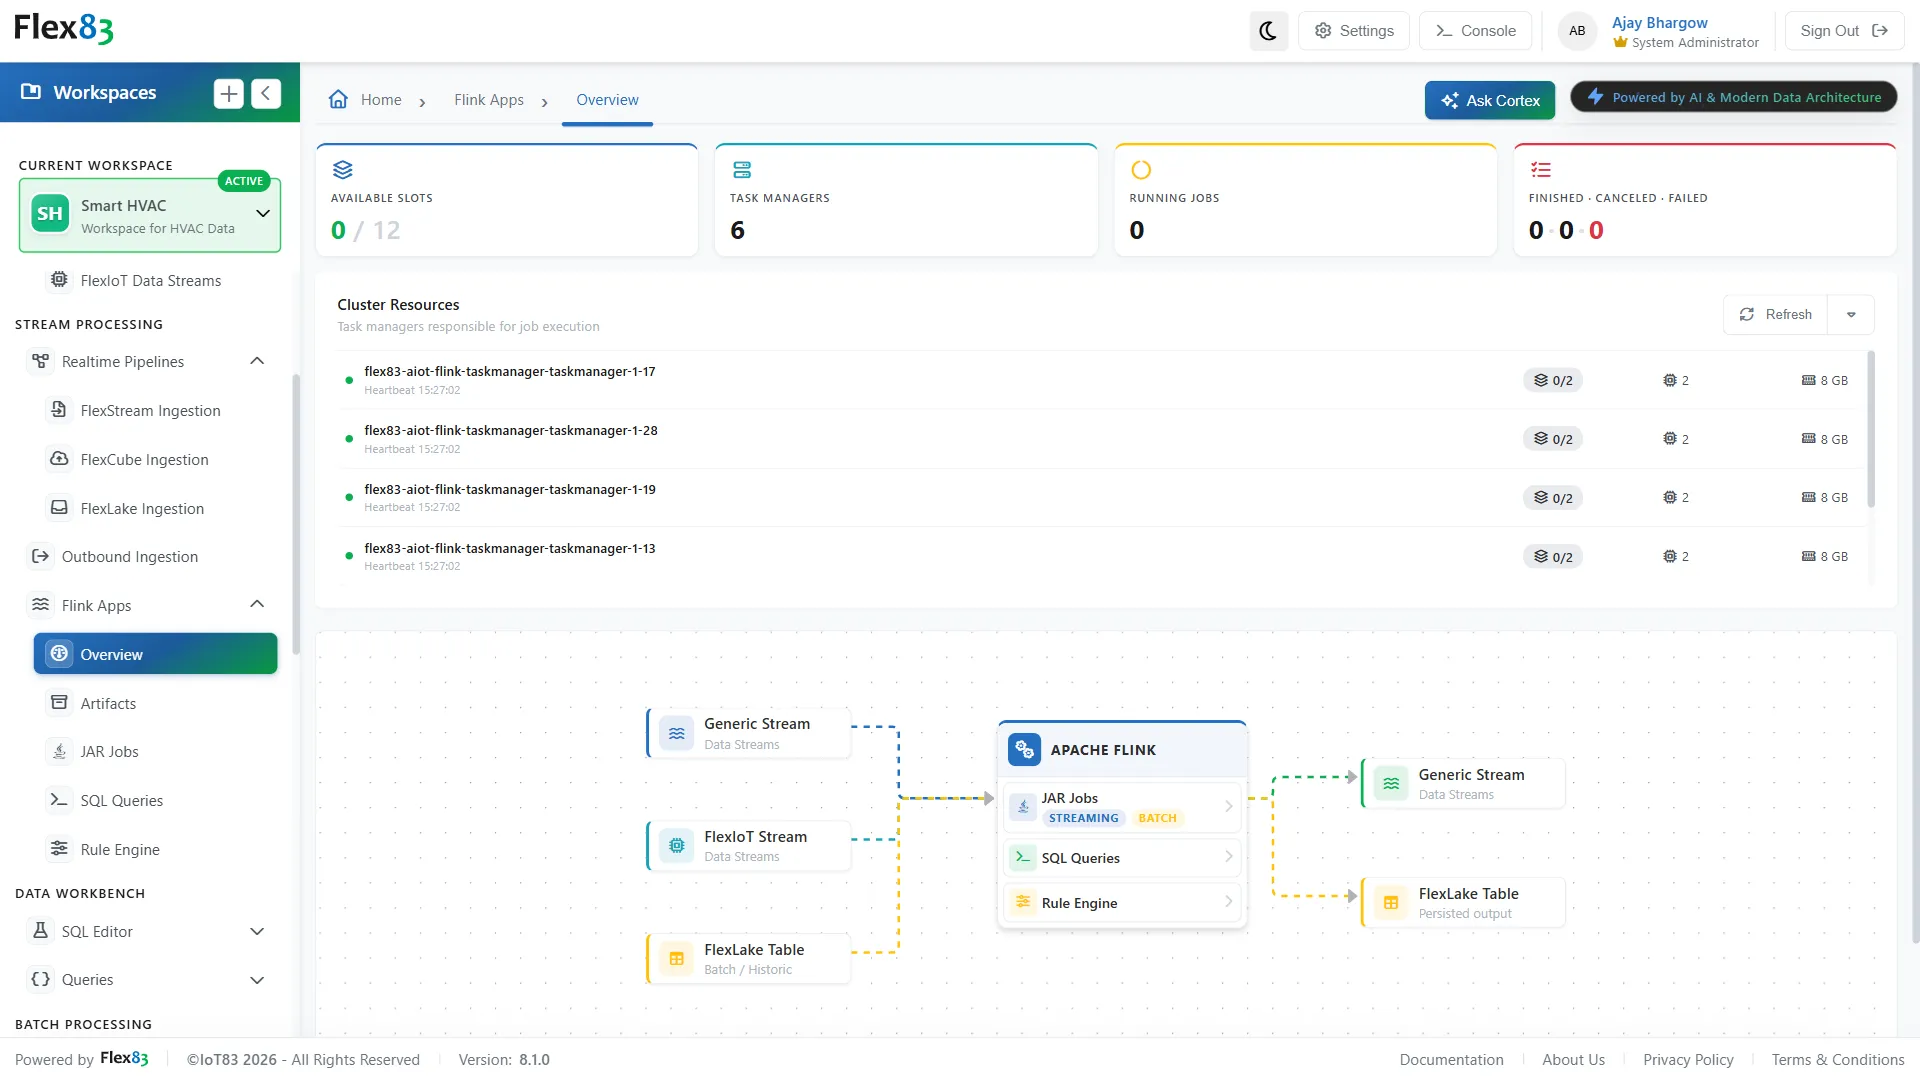
Track Flink, Trino, and MinIO natively
Get workload-specific visibility beyond standard platform telemetry, each engine measured on its own terms, not squeezed into one generic chart.
.png)
Turn observability into faster resolution
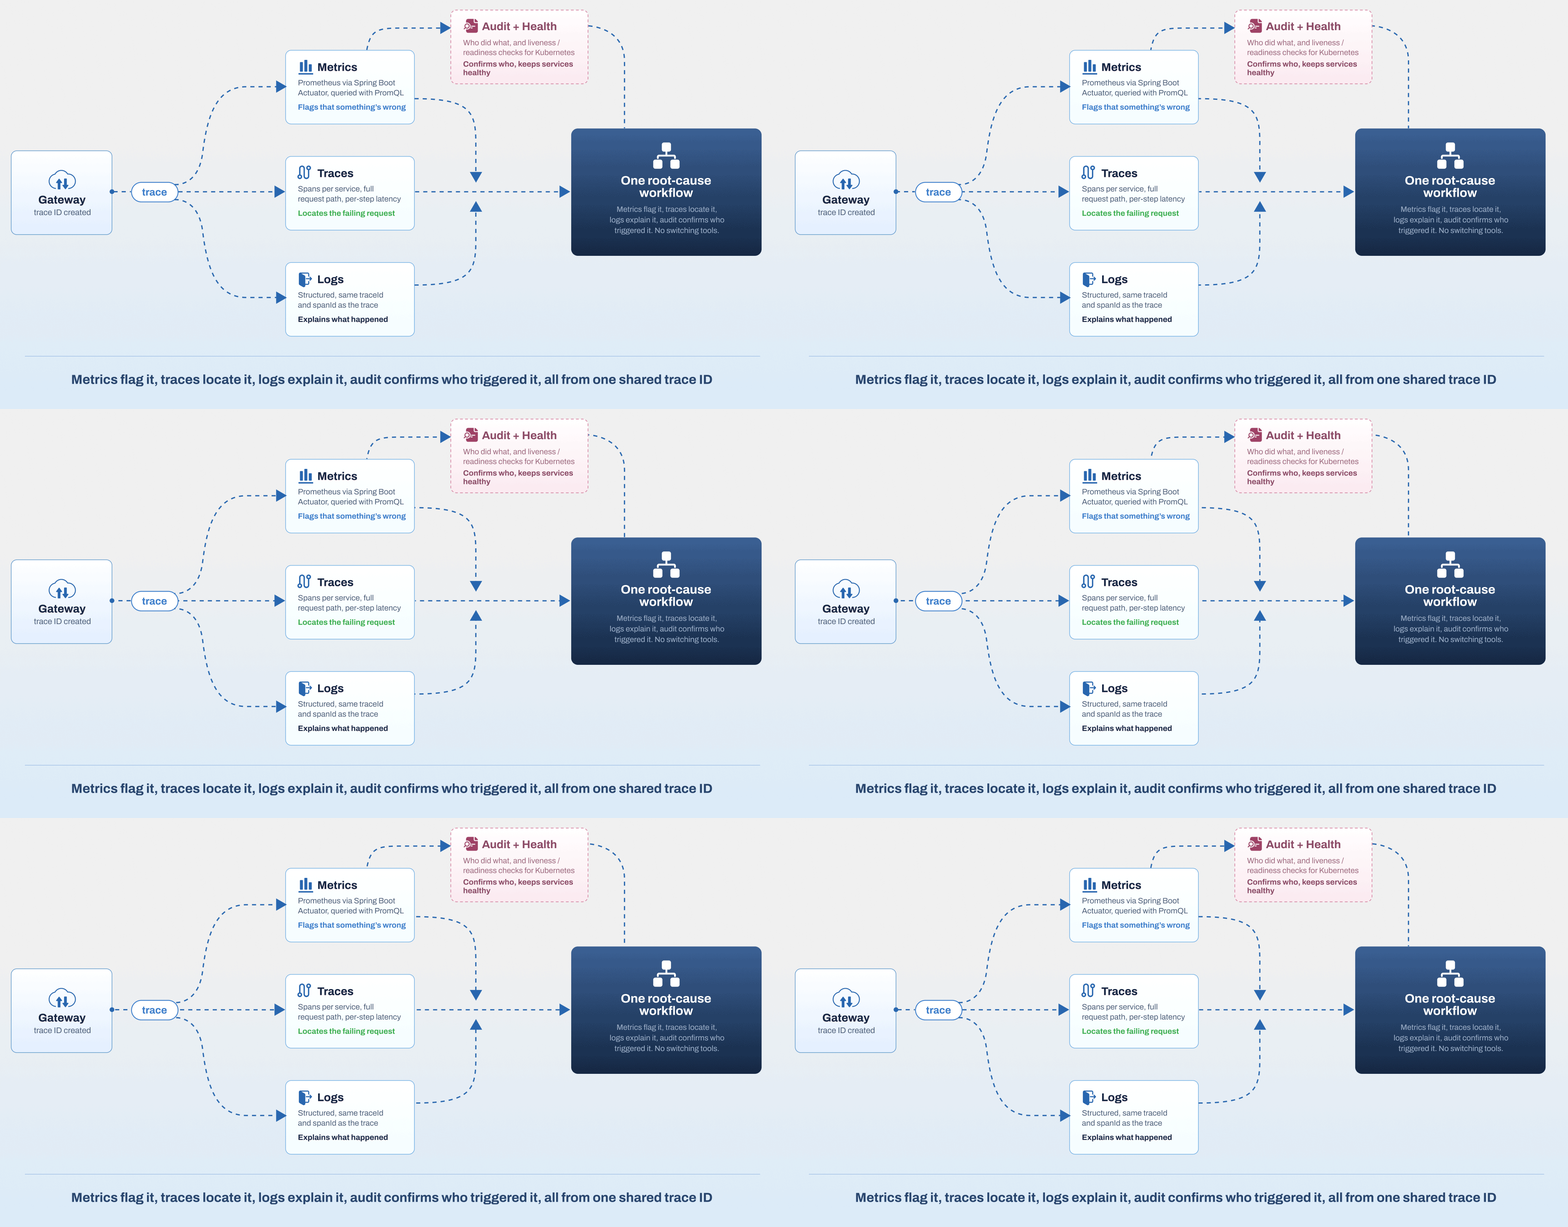
Connect platform performance, request flows, application events, service health, and user actions to shorten the path from detection to resolution.
Detect issues before they disrupt operations
Metrics and health checks expose rising error rates, latency, resource pressure, and failing dependencies as they emerge, giving teams an opportunity to act before service degradation spreads.
Trace failures across the microservice landscape
Distributed tracing follows a request across services and shows where latency or failure enters the flow. Shared trace and span IDs then connect that request directly to its related logs.
Move from symptoms to root cause
Logs provide the detailed events behind a failure, while traces provide the request context around it. Together, they let teams investigate the same incident across services without piecing together disconnected evidence.
Reconstruct platform activity with audit trails
Audit logging records significant platform actions with the user, endpoint, timing, outcome, and request context. Teams can use that history to investigate changes, review incidents, and support operational accountability.
Where observability drives value
Apply connected observability across the platform to keep services reliable, troubleshoot faster, and maintain operational control.
Industrial applications
Track the services and data flows powering connected industrial applications. Identify performance issues and failures before they disrupt operational workflows.
Connected products
Trace requests across the services behind connected products. Diagnose issues in device communication, data processing, and customer-facing applications with full request context.
Data and streaming workloads
Track the health and performance of data-intensive workloads, including Flink, Trino, and MinIO, alongside Kafka consumer lag and dependency health. Identify processing failures, query issues, and resource constraints as they emerge.
Platform operations
Give engineering and operations teams a connected view of service health, performance, and platform activity. Use health checks, audit records, metrics, traces, and logs to investigate incidents and maintain operational control.
Frequently Asked Questions
What is observability and why is it important?
Observability is the ability to understand what is happening inside a system by analyzing the data it produces. It helps teams detect issues, investigate their causes, and understand system behavior by connecting metrics, traces, logs, and other operational signals.
What observability signals does Flex83 support?
Flex83 supports the three core observability pillars: metrics, traces, and logs. It also provides audit logging and service health checks for operational monitoring, troubleshooting, governance, and reliability.
What is the difference between monitoring and observability?
Monitoring typically focuses on tracking predefined system conditions and alerts. Observability goes further by providing the context needed to investigate unexpected behavior and determine why an issue occurred.
How does Flex83 help troubleshoot microservices?
Flex83 lets teams follow requests across microservices using distributed traces, then correlate those requests with logs using trace and span IDs. This helps identify where a request slowed down or failed and inspect the events behind the issue.
How does Flex83 monitor service health?
Flex83 microservices expose health endpoints through Spring Boot Actuator. Liveness and readiness probes help determine whether services are running and ready to receive traffic, while health details can include dependencies such as databases, Redis, Kafka, and disk space.
Can Flex83 observability support compliance and governance?
Yes. Flex83's audit logging records significant platform actions and provides searchable audit analytics. Feature flags also control audit-compliance logging and observability usage analytics.
How does observability improve application performance?
Observability helps teams identify performance changes, locate bottlenecks, and understand which services or operations contribute to latency. This makes it easier to investigate performance problems and prioritize corrective action.
Turn platform signals into action
Connect the context behind every issue, giving your team a clear path from detection to diagnosis and resolution.