
Optimize Every Process — Line, Cell, Recipe, Shift
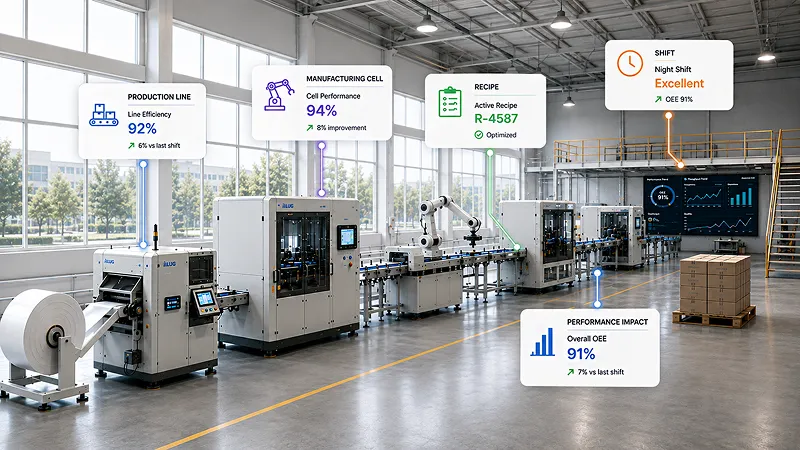
Process optimization is the highest-ROI industrial AI use case — and the most often stuck at spreadsheets. Flex83 turns plant-floor data into live OEE, yield, energy, and quality analytics, with closed-loop control built in. From one cell to enterprise-wide, on one platform.
Trusted by teams at global enterprises
for industrial data and asset ecosystem















Why Process Improvements Don't Compound
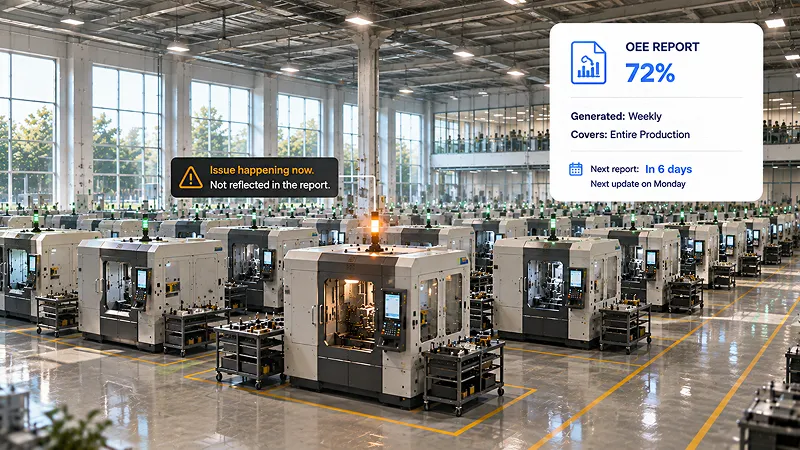
1. OEE measured weekly. Decisions needed hourly.
Most plants compute OEE in spreadsheets after the shift. By the time the number is available, the opportunity to act on it is gone.
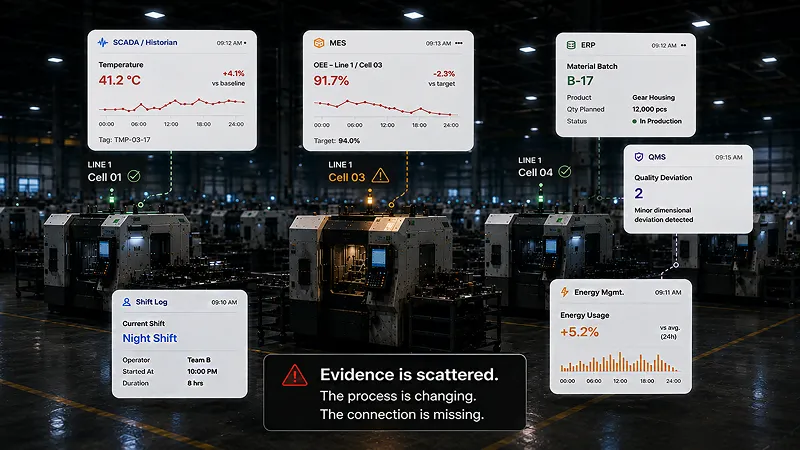
2. Yield losses hide in the noise
Quality engineers know the line drifts. Nobody can prove which parameter, on which shift, for which product mix — without a unified data model and AI to surface the pattern.
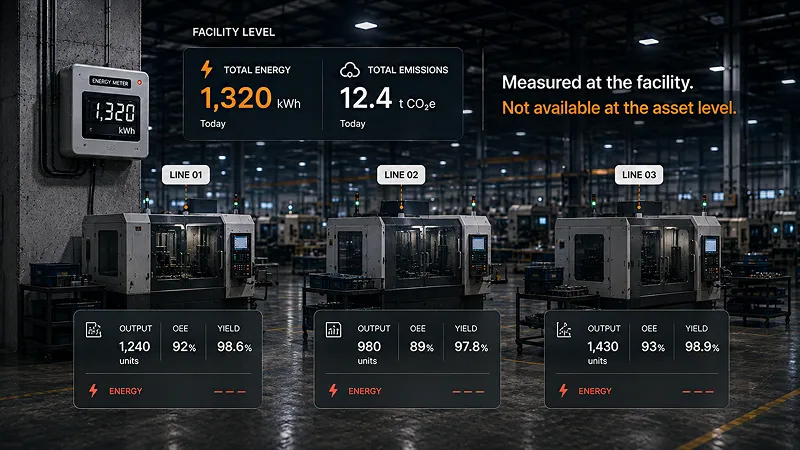
3. Energy and emissions ignored at the line level
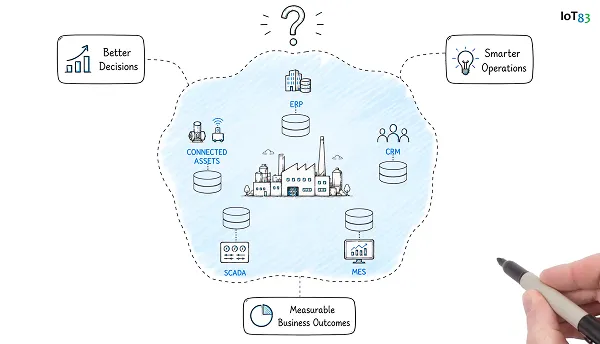
Energy and emissions data lives at the meter, not at the asset. Process-level optimization is impossible without joining them.
Flex83 for Process Optimization
.webp)
1. Real-Time OEE, Yield, and Energy
Live OEE per line, per asset, per shift. Yield computed in real time. Energy and emissions joined at the asset, not the meter. One unified process view, refreshed continuously.
.webp)
2. AI-Driven Root Cause Analysis
When OEE or yield drifts, Flex83 surfaces the top contributing factors automatically — asset, parameter, shift, product mix, ambient conditions. Quality engineers stop hunting; they start fixing.
.webp)
3. Closed-Loop Control Where It's Safe
Flex83 can recommend, or — where governance allows — automatically adjust set-points within safe bands. Every adjustment is logged, lineaged, and reviewable.
.avif)
4. Plant-to-Enterprise Benchmarking
The same data model spans plants, lines, and product families. Benchmark across the enterprise. Surface best-shift, best-line, best-recipe patterns — and propagate them.
From Reactive. To Predictive. To Competitive.
improvement in OEE
reduction in scrap & rework
energy-per-unit reduction
Improvements That Compound
Every shift's data sharpens the next shift's recommendations. Best practices propagate. OEE doesn't just rise — it stays risen.
Sustainability as a By-Product
Energy and emissions per unit are tracked at the same granularity as OEE. ESG reporting stops being a separate project.
From Pilot to Production in Weeks, Not Years
Weeks 1–2
Weeks 3–6
Weeks 7–12
Weeks 13–16
Weeks 17+
Resources
.webp)
.webp)
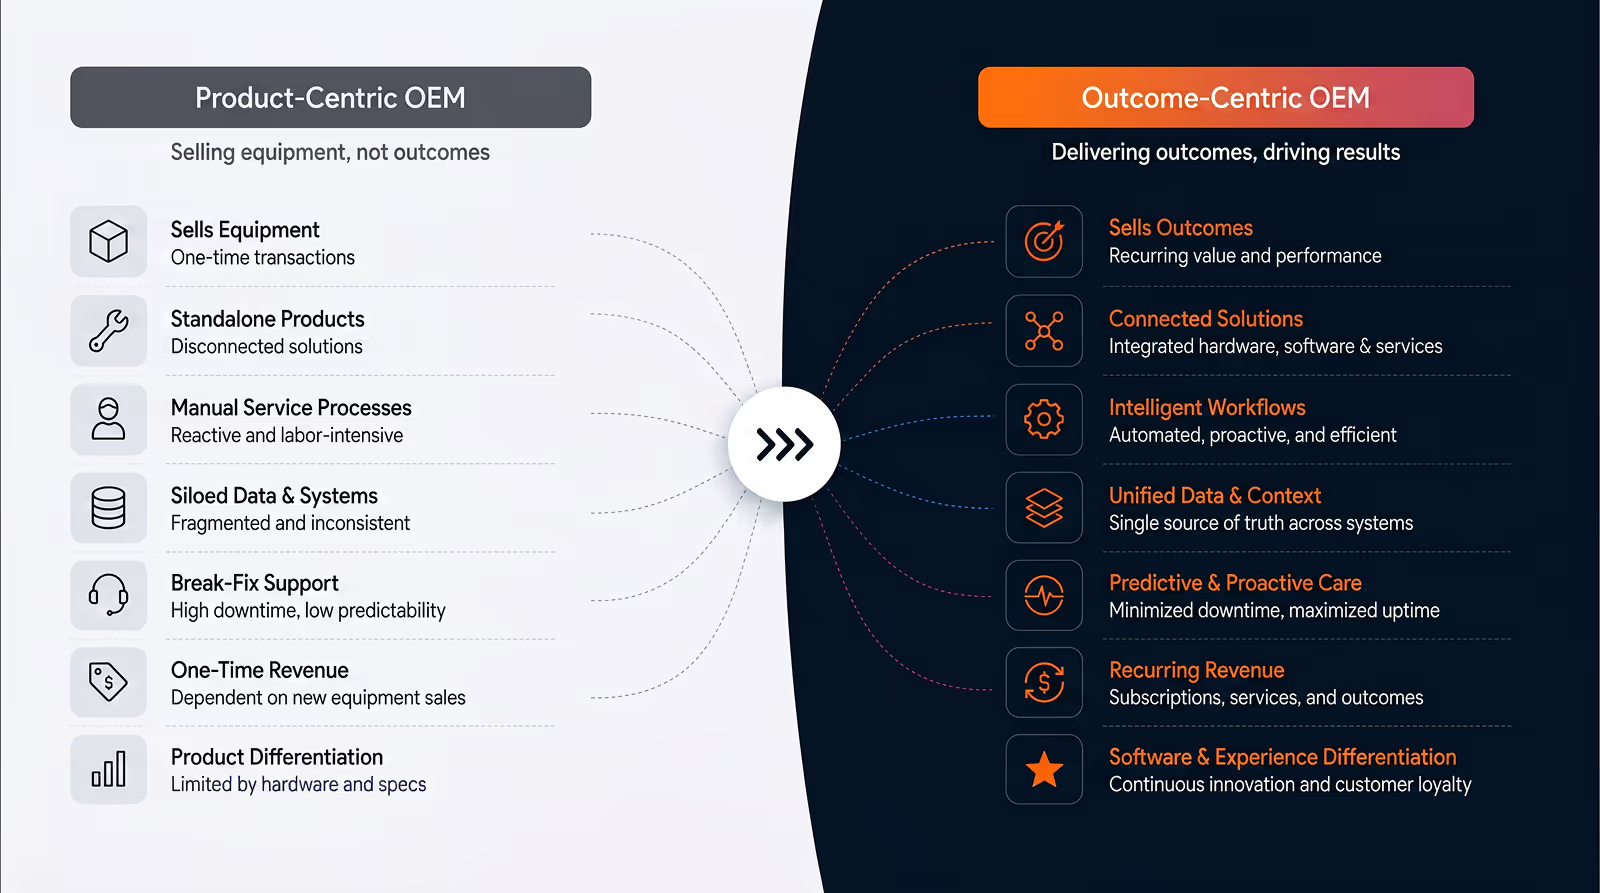
Industrial OEMs Are Becoming Software Companies — Most Haven’t Updated Their Platform Strategy Yet


Process Improvements That Stay Improved
Tell us about your highest-impact process pain — OEE, yield, energy, quality — and the data you already collect. We'll map a 12-week path to live, AI-driven process optimization on Flex83.