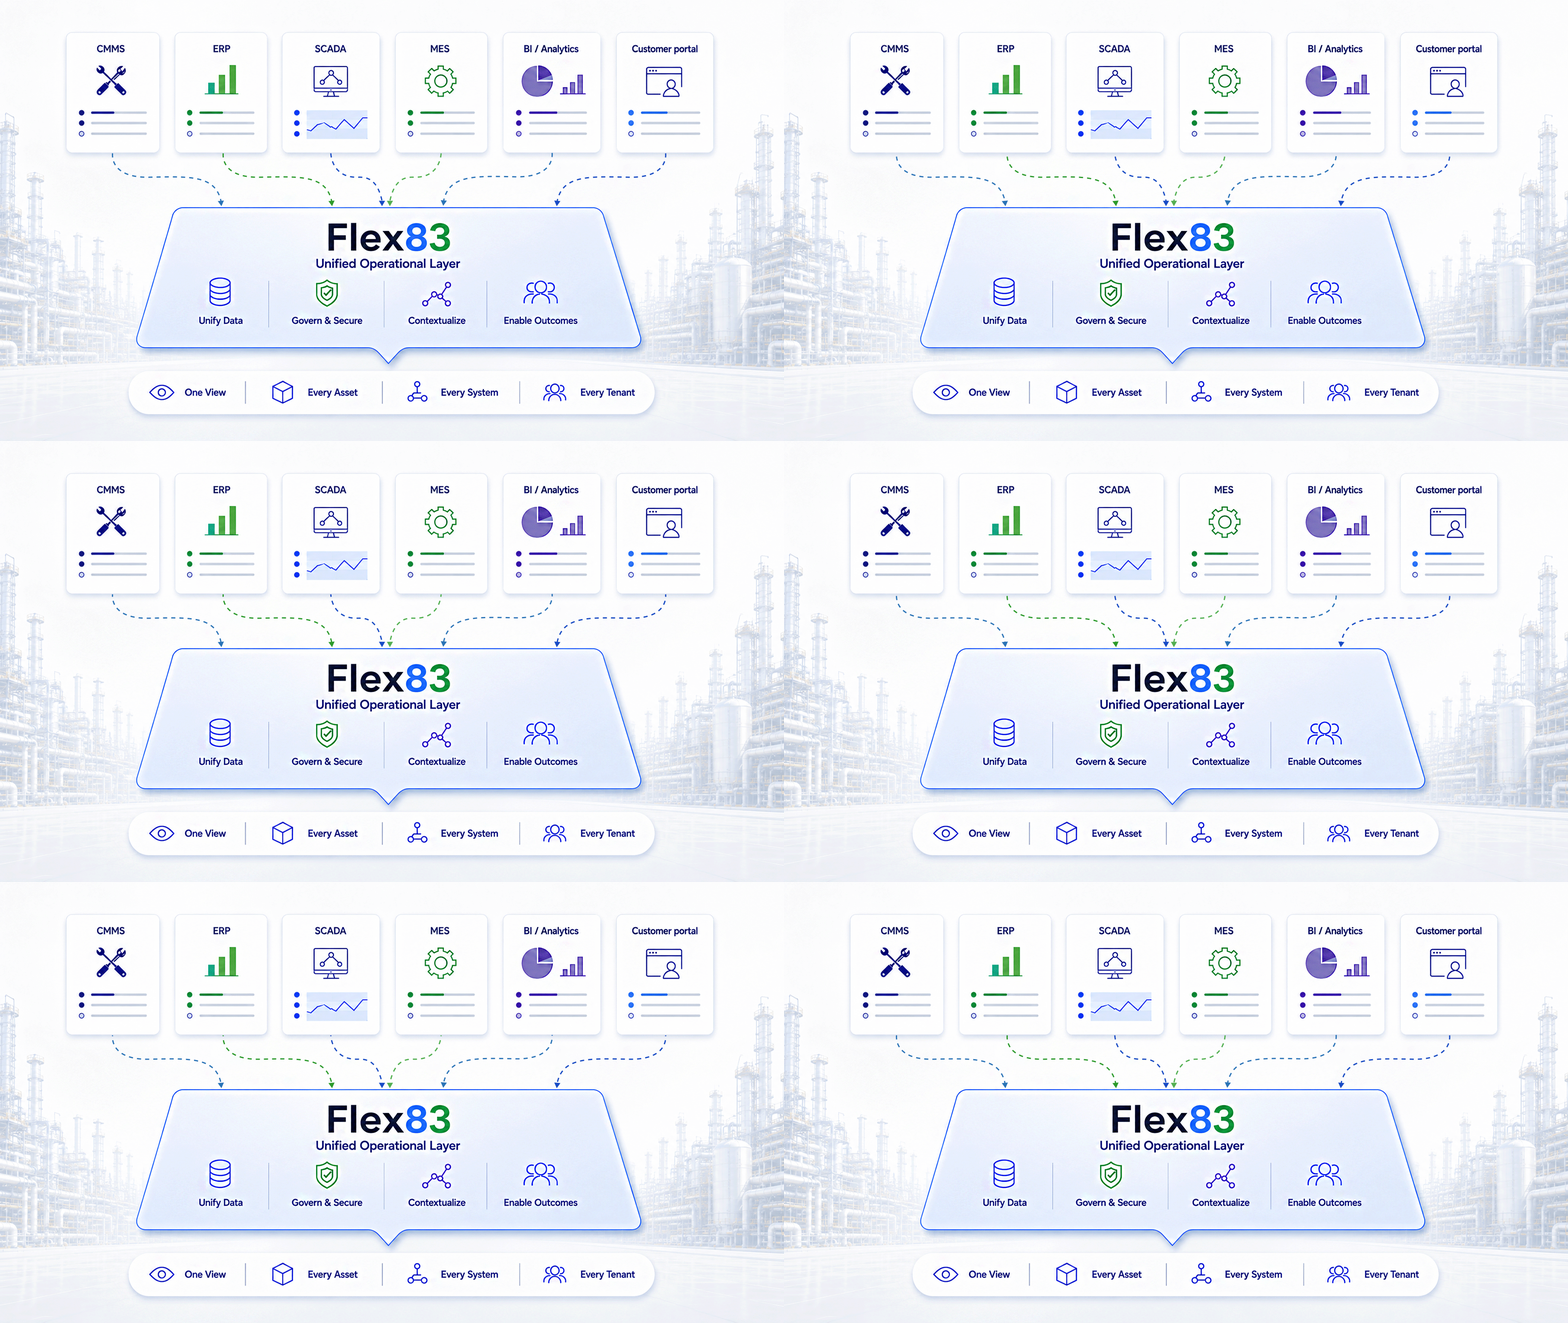
One View. Every Asset. Every System. Every Tenant.
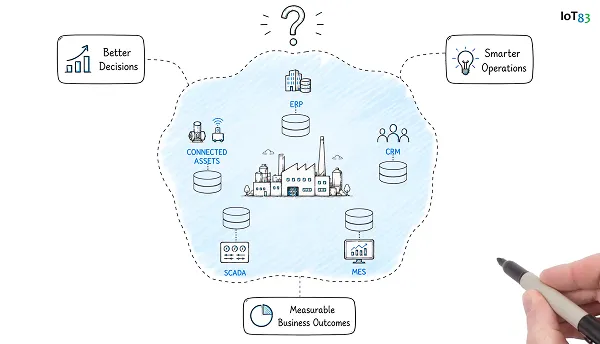
Operations leaders are drowning in dashboards — CMMS, ERP, SCADA, MES, BI, custom portals. Flex83's Single Pane of Glass collapses them into one governed, real-time view: every asset, every site, every system, with role-based access and full data lineage underneath.
Trusted by teams at global enterprises
for industrial data and asset ecosystem















Why 'Visibility' Still Hurts
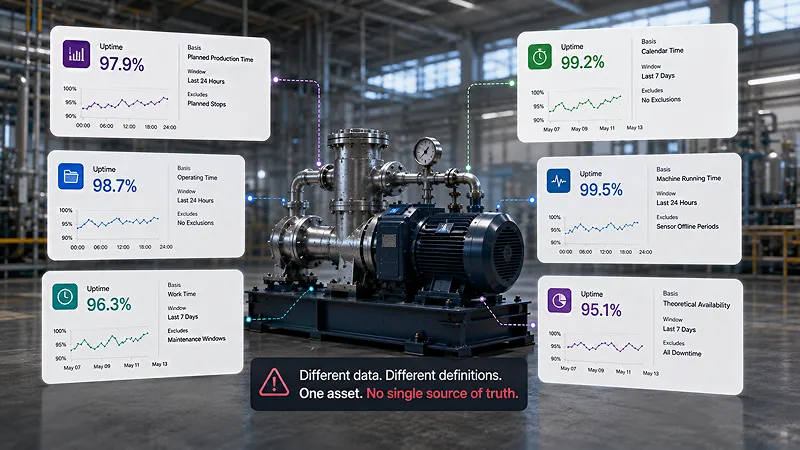
1. Seven dashboards, eight definitions of uptime
When every tool computes 'uptime' differently, ops meetings start with reconciling numbers instead of acting on them. Trust in data erodes. Decisions get delayed.
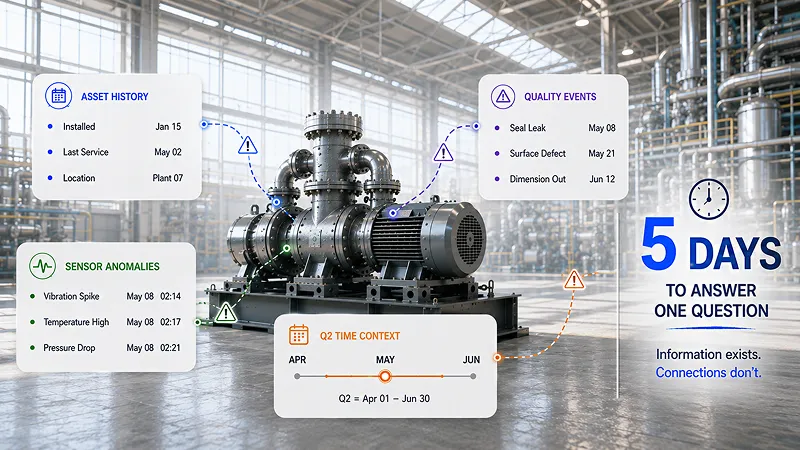
2. Cross-system answers take days
'Which assets had a quality issue in Q2 that correlated with sensor anomalies?' is a five-system question. Without a unified view, it's a five-day project.
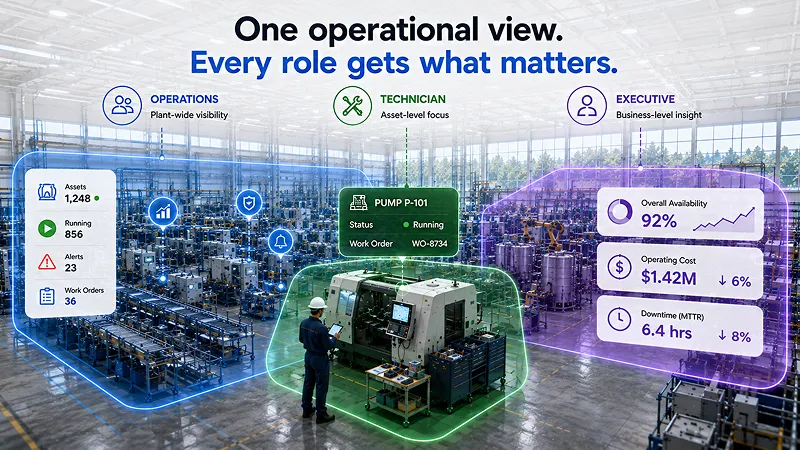
3. Role-appropriate views are an afterthought
Operations needs plant-wide; technicians need their work orders; executives need a summary. Most tools force everyone into the same screen — and then bolt on permissions later.
Flex83 Single Pane of Glass
.webp)
1. Unified Data Foundation
Every system you operate — OT, IT, IoT, ET — feeds the same governed data layer. The SPoG isn't a screen; it's the natural expression of one truth across systems.

2. Role-Tailored Views, Built In
Operators see plant-wide telemetry. Maintenance sees work orders mapped to assets. Executives see KPIs by site or business unit. Customers (in multi-tenant deployments) see only what you choose to expose.

3. Drill From Summary to Sensor
Click any KPI to drill down — site → line → asset → sensor → raw signal — with lineage preserved at every step. Trust isn't a feature; it's a default.

4. Open APIs and Embeddable Tiles
Embed SPoG tiles in your existing intranet, portal, or BI tool. Or pull data via Open Catalog APIs into ServiceNow, SAP, Tableau, Power BI. The SPoG is wherever your operators already work.
From Reactive. To Predictive. To Competitive.
reduction in dashboard count
faster cross-system queries
fewer 'data reconciliation' hours per week
One Number. One Source. One Decision.
Ops meetings start with action, not arithmetic. Executives trust the dashboard because the dashboard trusts the data.
Customers See What You Want Them to See
Multi-tenant SPoG views become a customer-facing product — service-level transparency that differentiates your offer.
From Pilot to Production in Weeks, Not Years
Weeks 1–2
Weeks 3–6
Weeks 7–12
Weeks 13–16
Weeks 17+
Resources
.webp)
.webp)
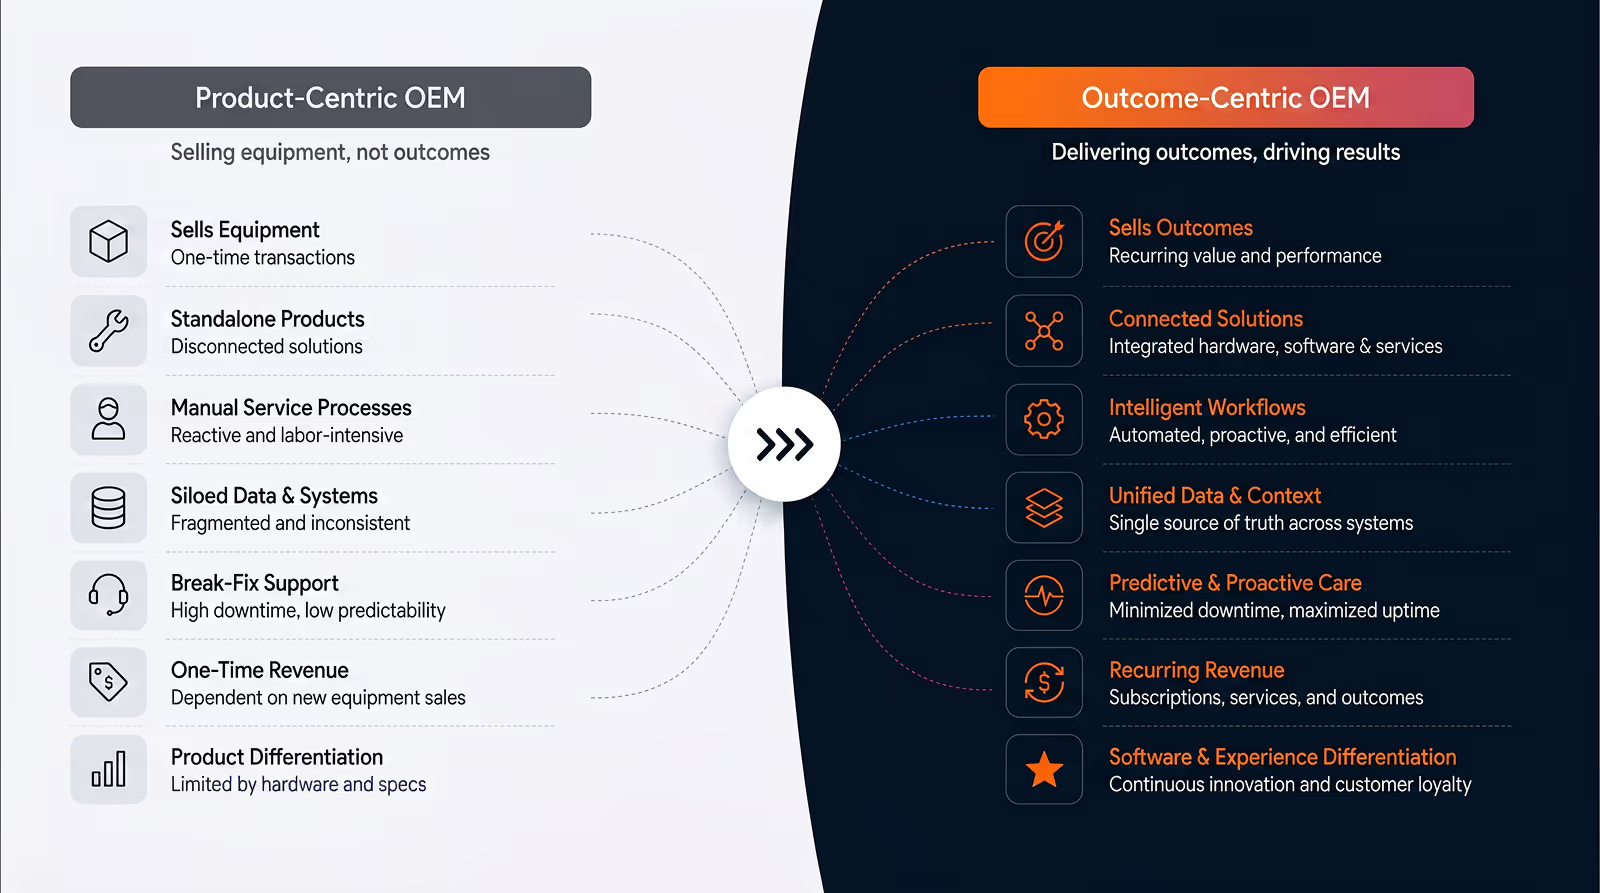
Industrial OEMs Are Becoming Software Companies — Most Haven’t Updated Their Platform Strategy Yet


Operations Without Dashboard Tabs
Tell us about the dashboards your team lives in today, the KPIs that drive ops decisions, and the questions that take too long to answer. We'll map a Single Pane of Glass on Flex83 in your environment.